We’ve introduced new tools to help users evaluate data quality and refine building models more efficiently. This release adds automated utility data quality checks to identify potential issues that could impact results, alongside a redesigned Energy Model workspace that brings building characterization insights and model refinement controls into a single view. Together, these updates make it easier to validate inputs, understand model assumptions, and improve confidence in decarbonization recommendations.
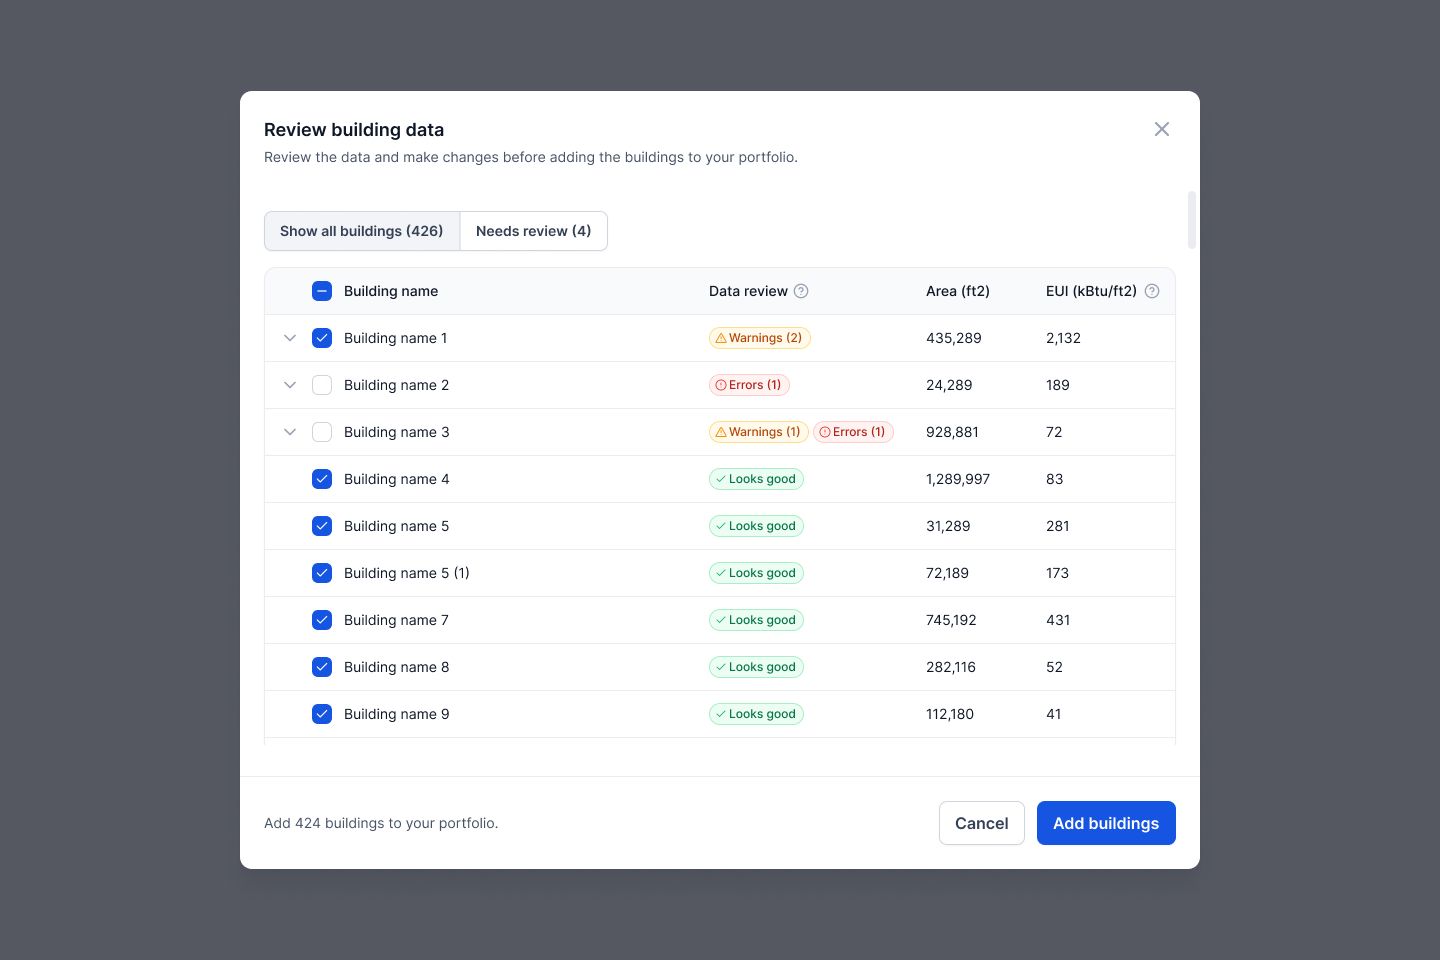
Utility Data Check
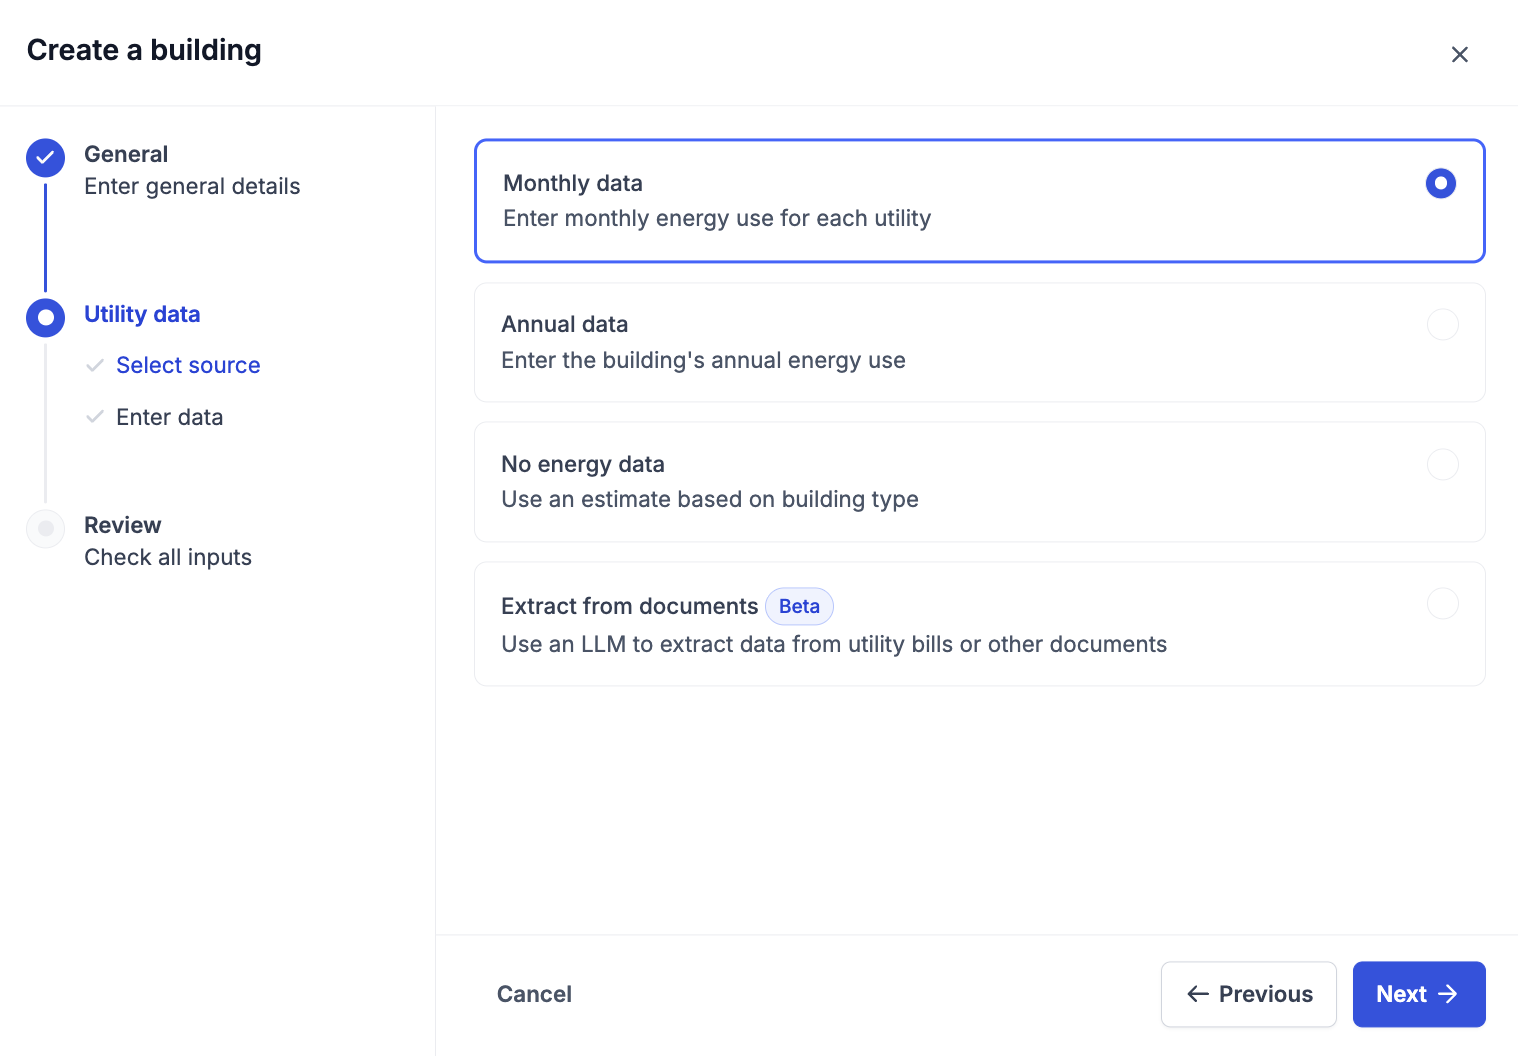
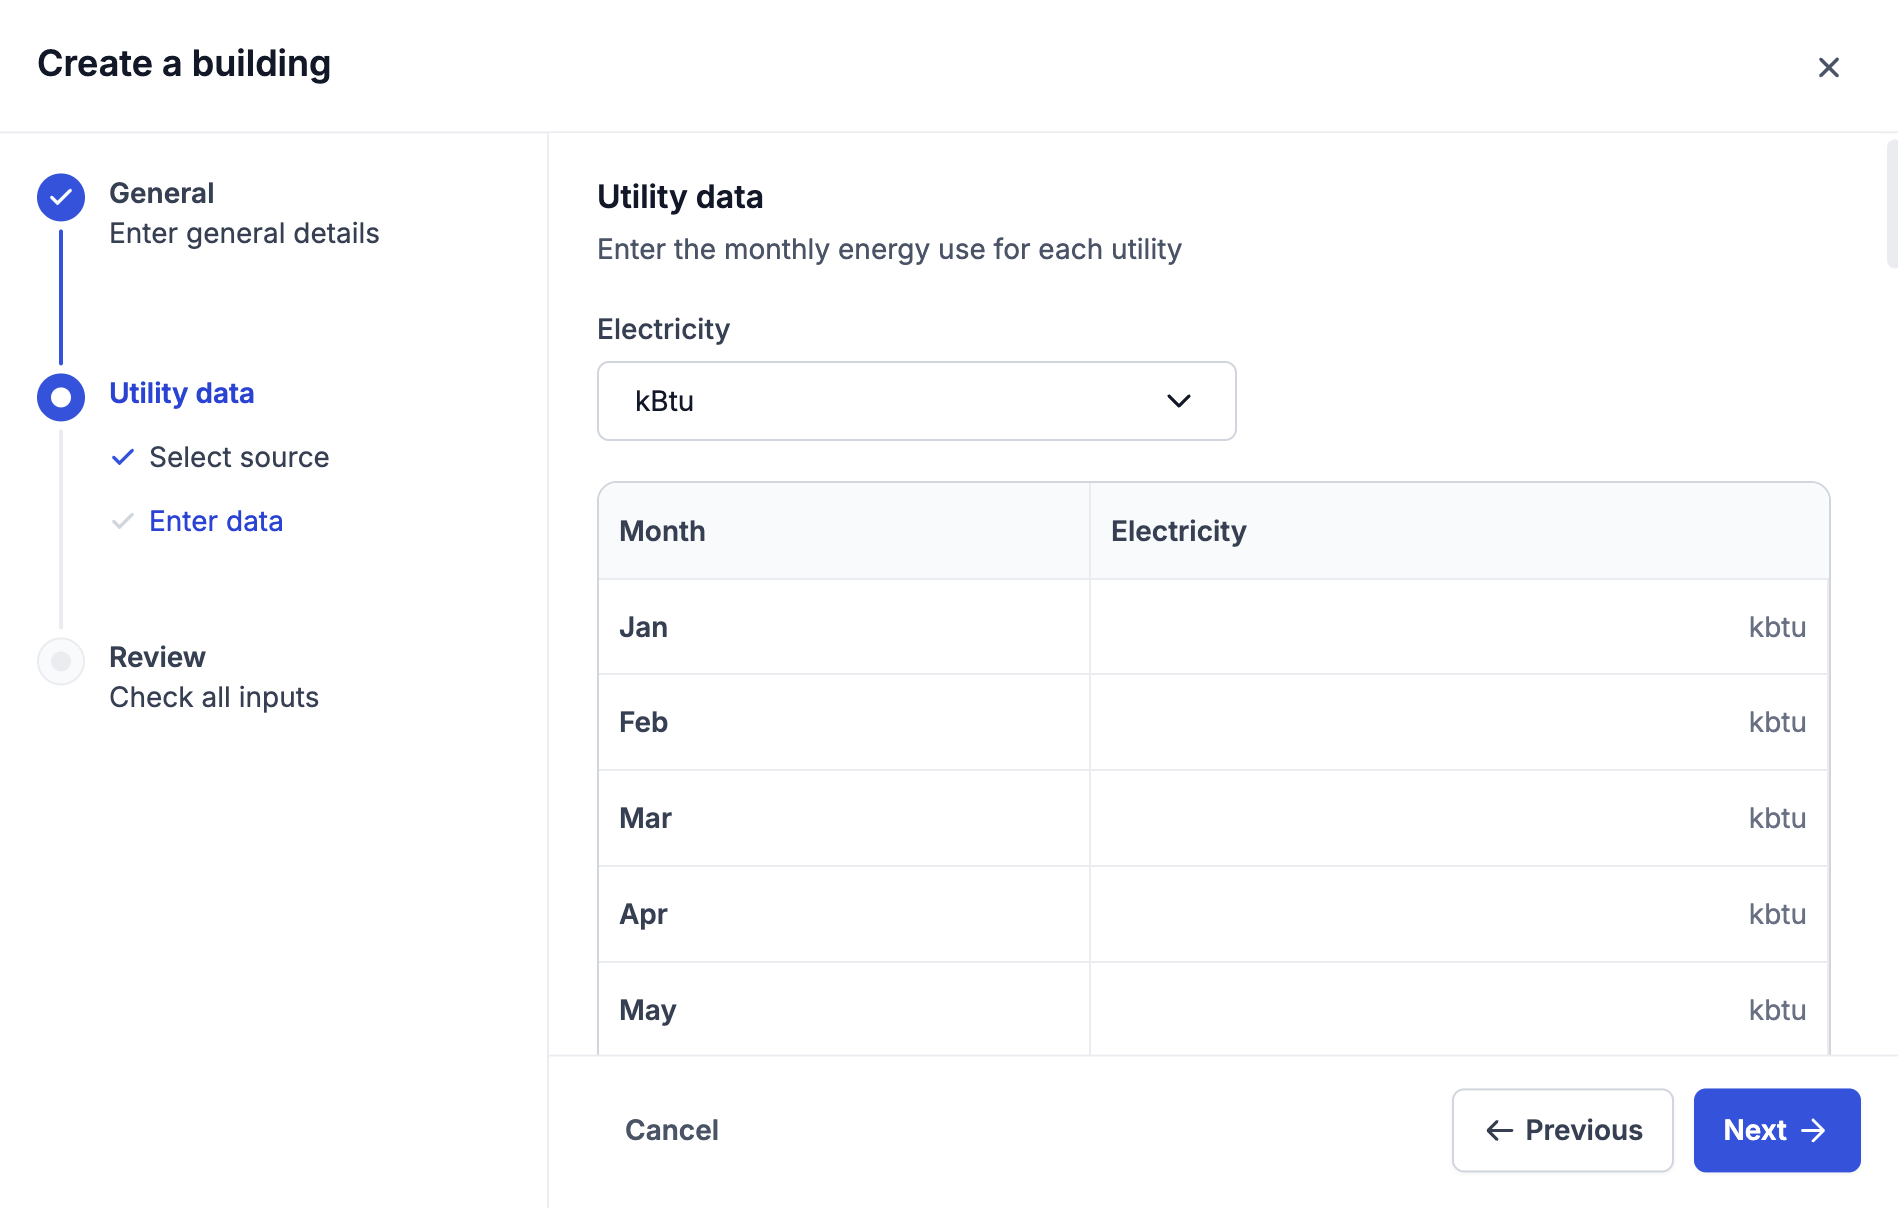
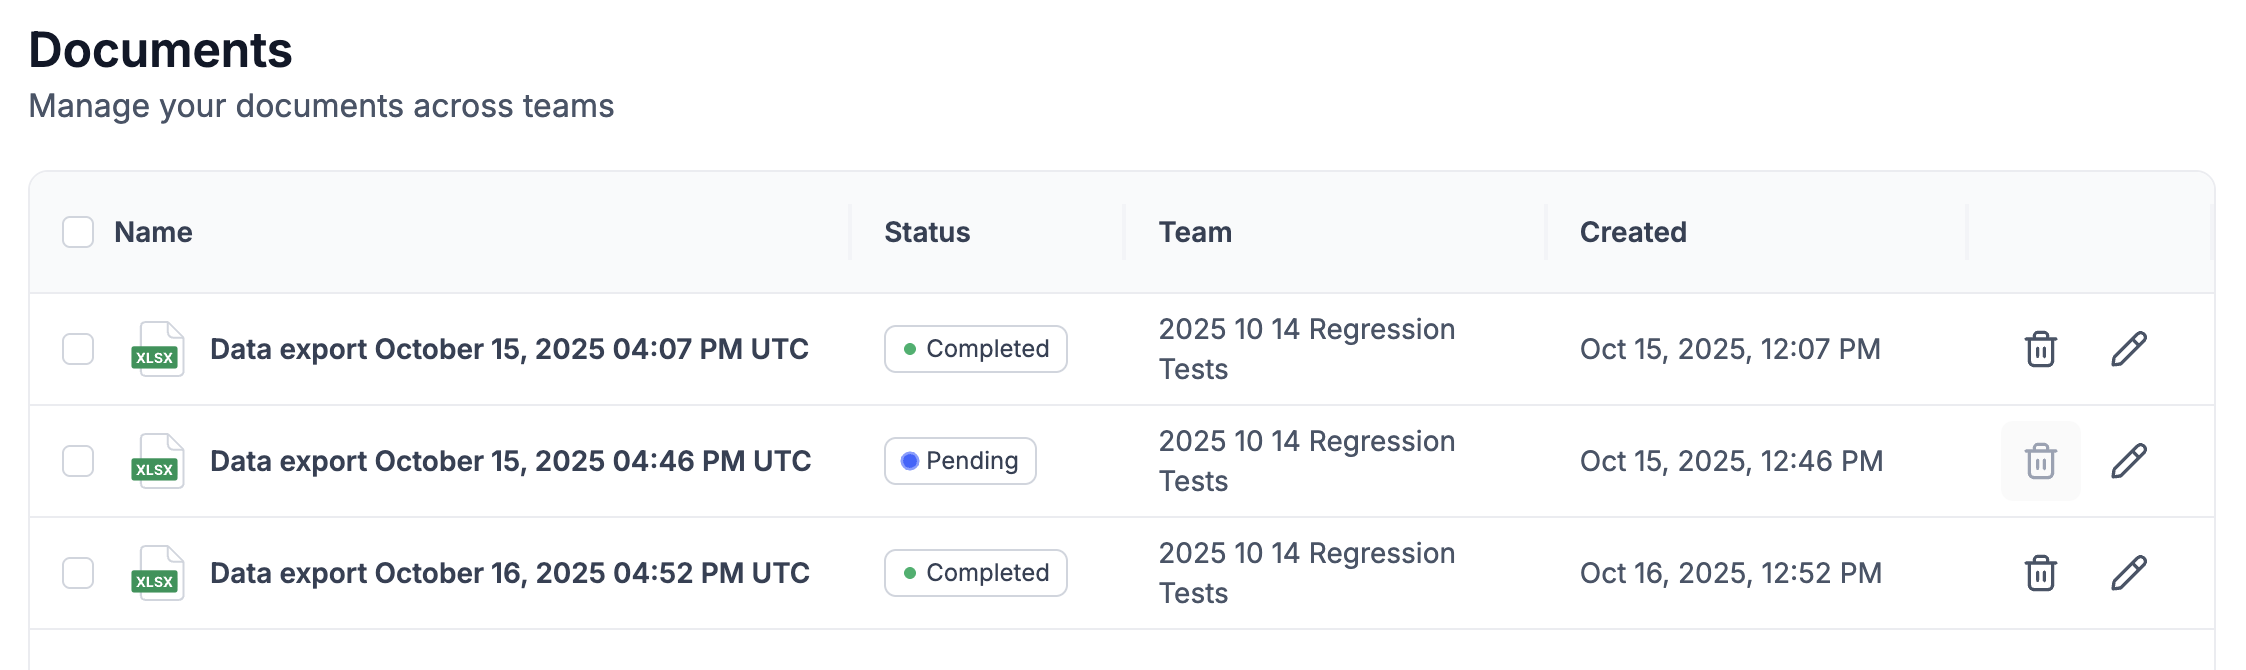
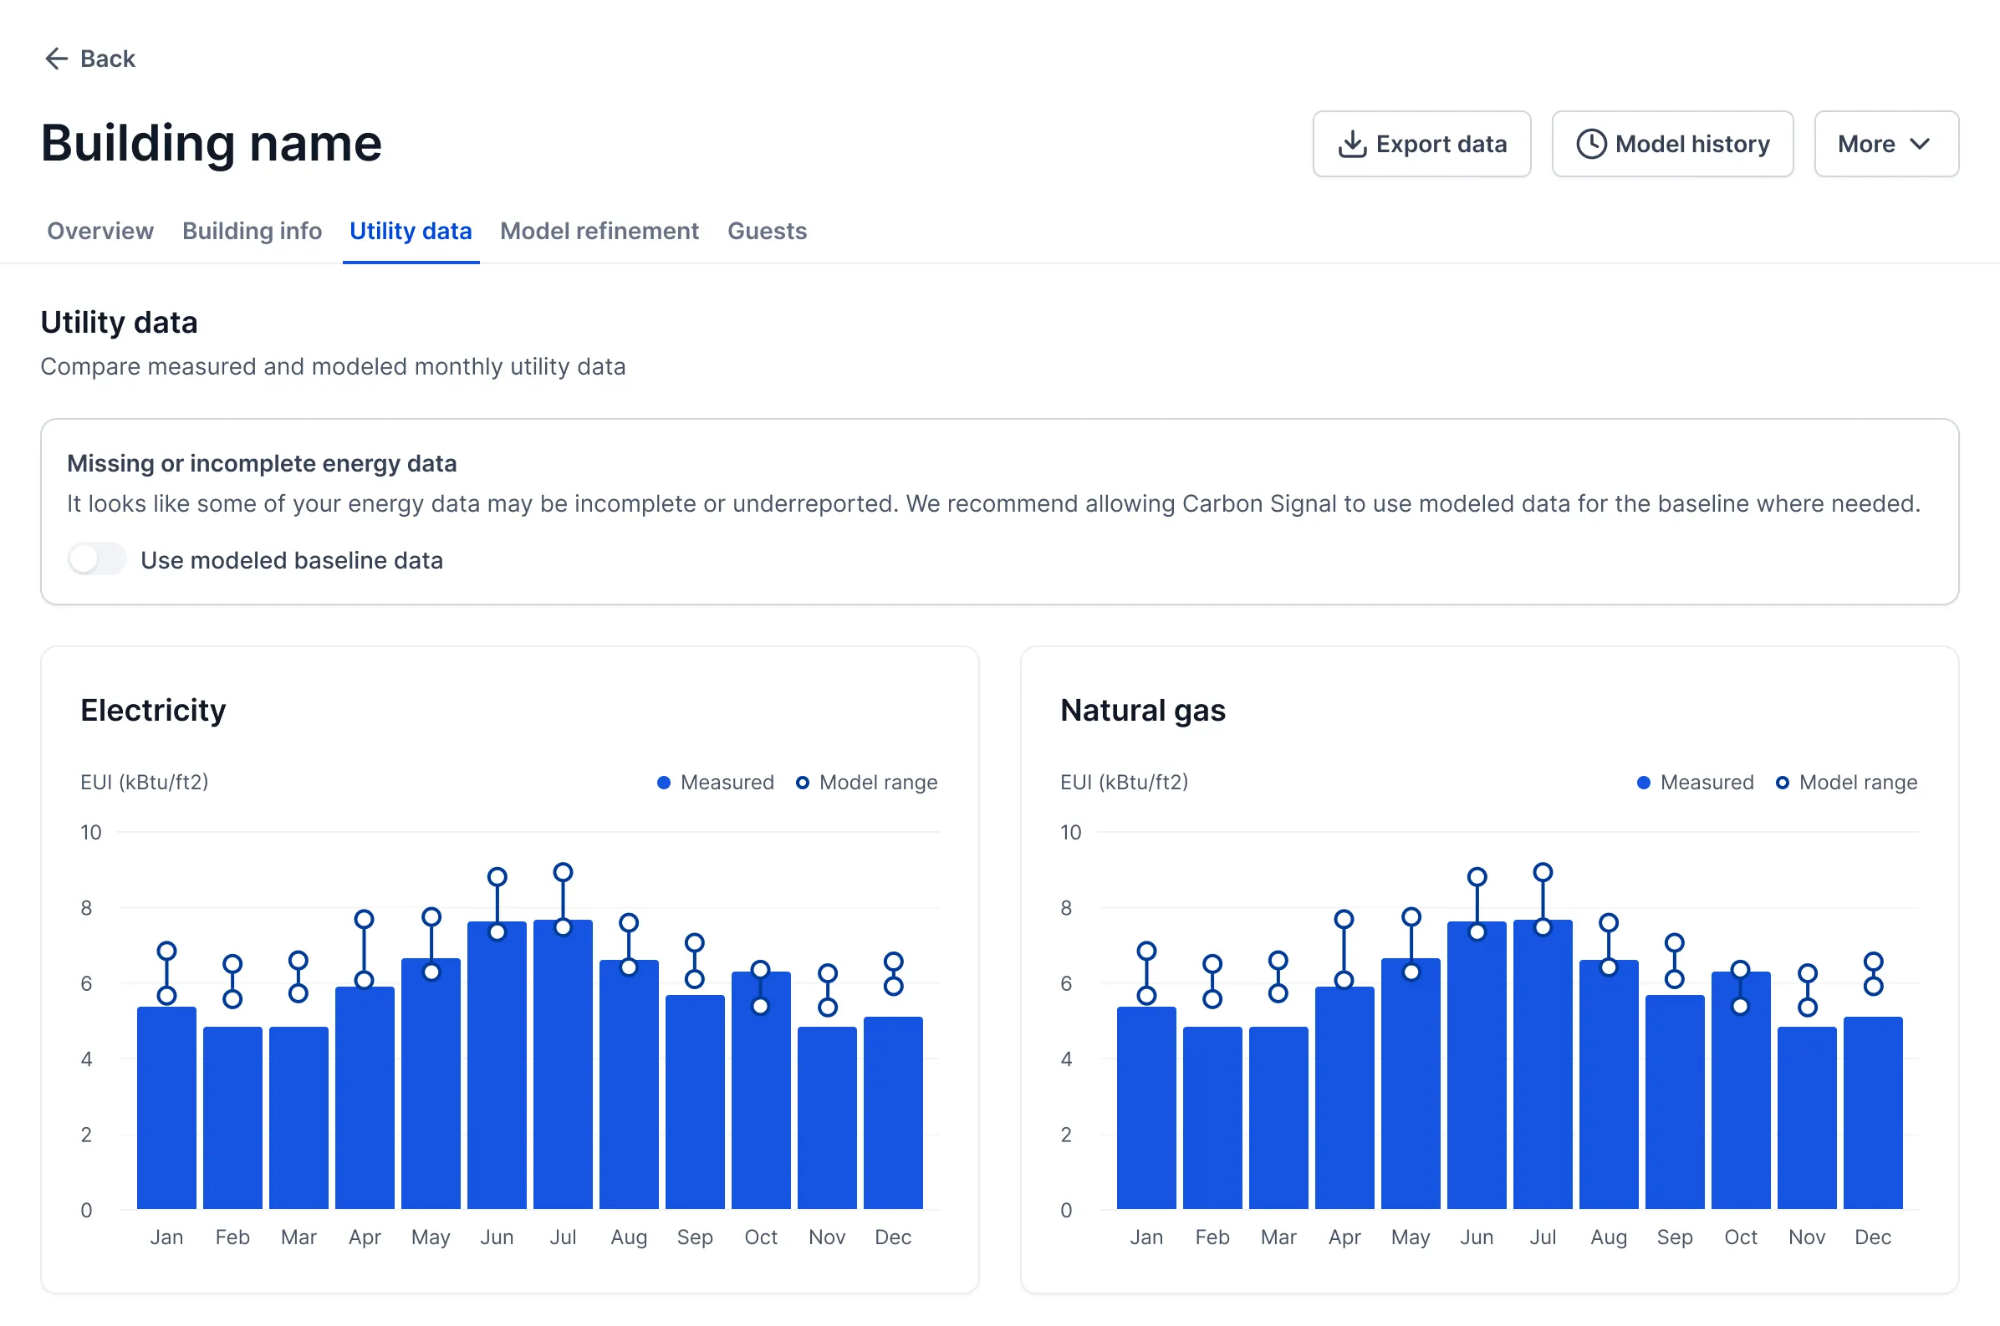
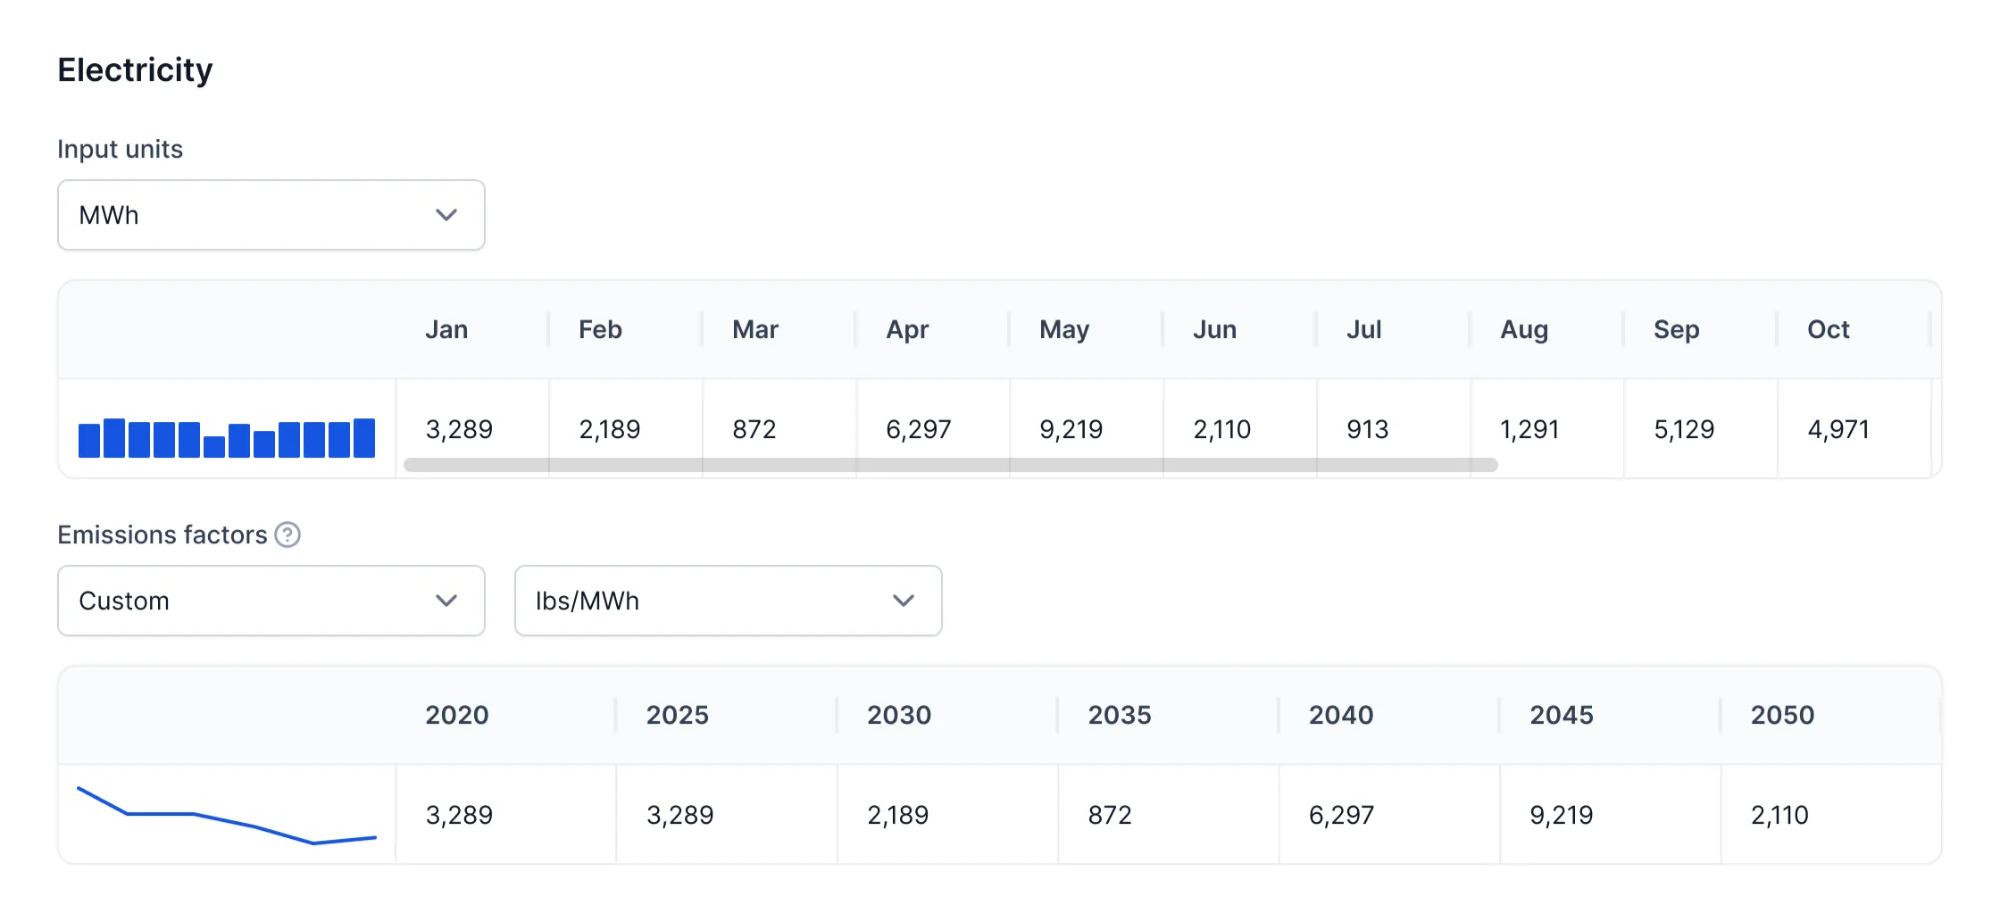
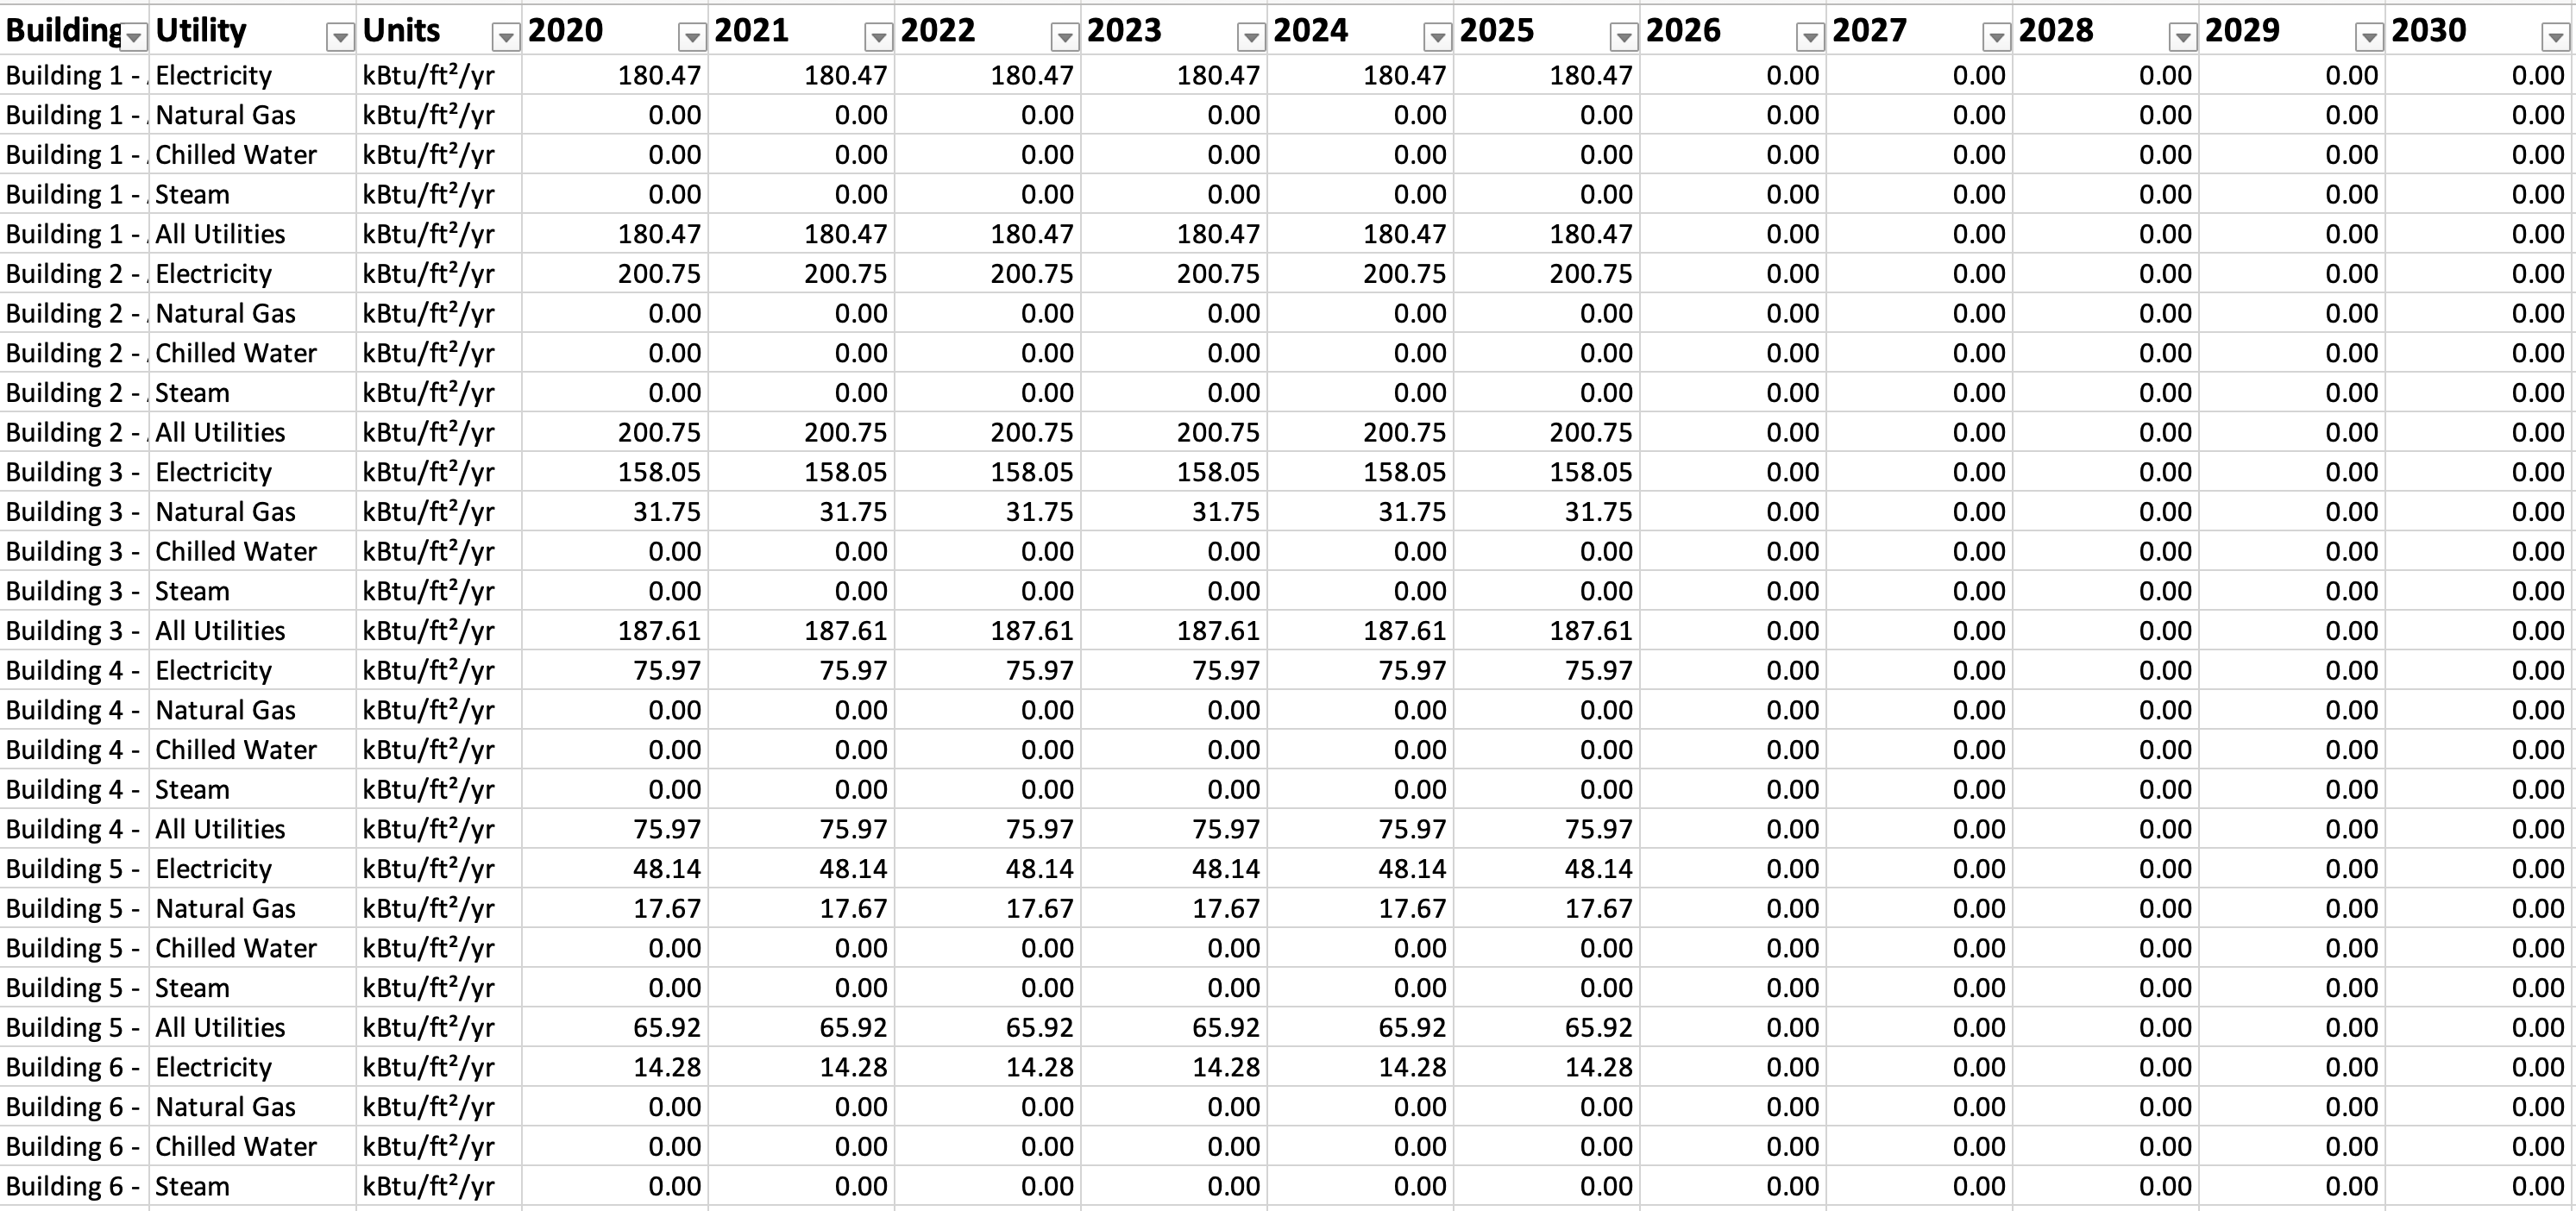
We’ve introduced a new Utility Data Check feature to help identify data quality issues that may have an impact on calibration results
Carbon Signal now automatically evaluates uploaded utility data across three key dimensions:
- Utility data coverage — identifies missing utility data and gaps in reporting
- Utility data anomalies — flags unusually high or low consumption and unexpected seasonal patterns
- Utility data alignment — measures how well reported utility data aligns with modeled energy use based on industry best practices
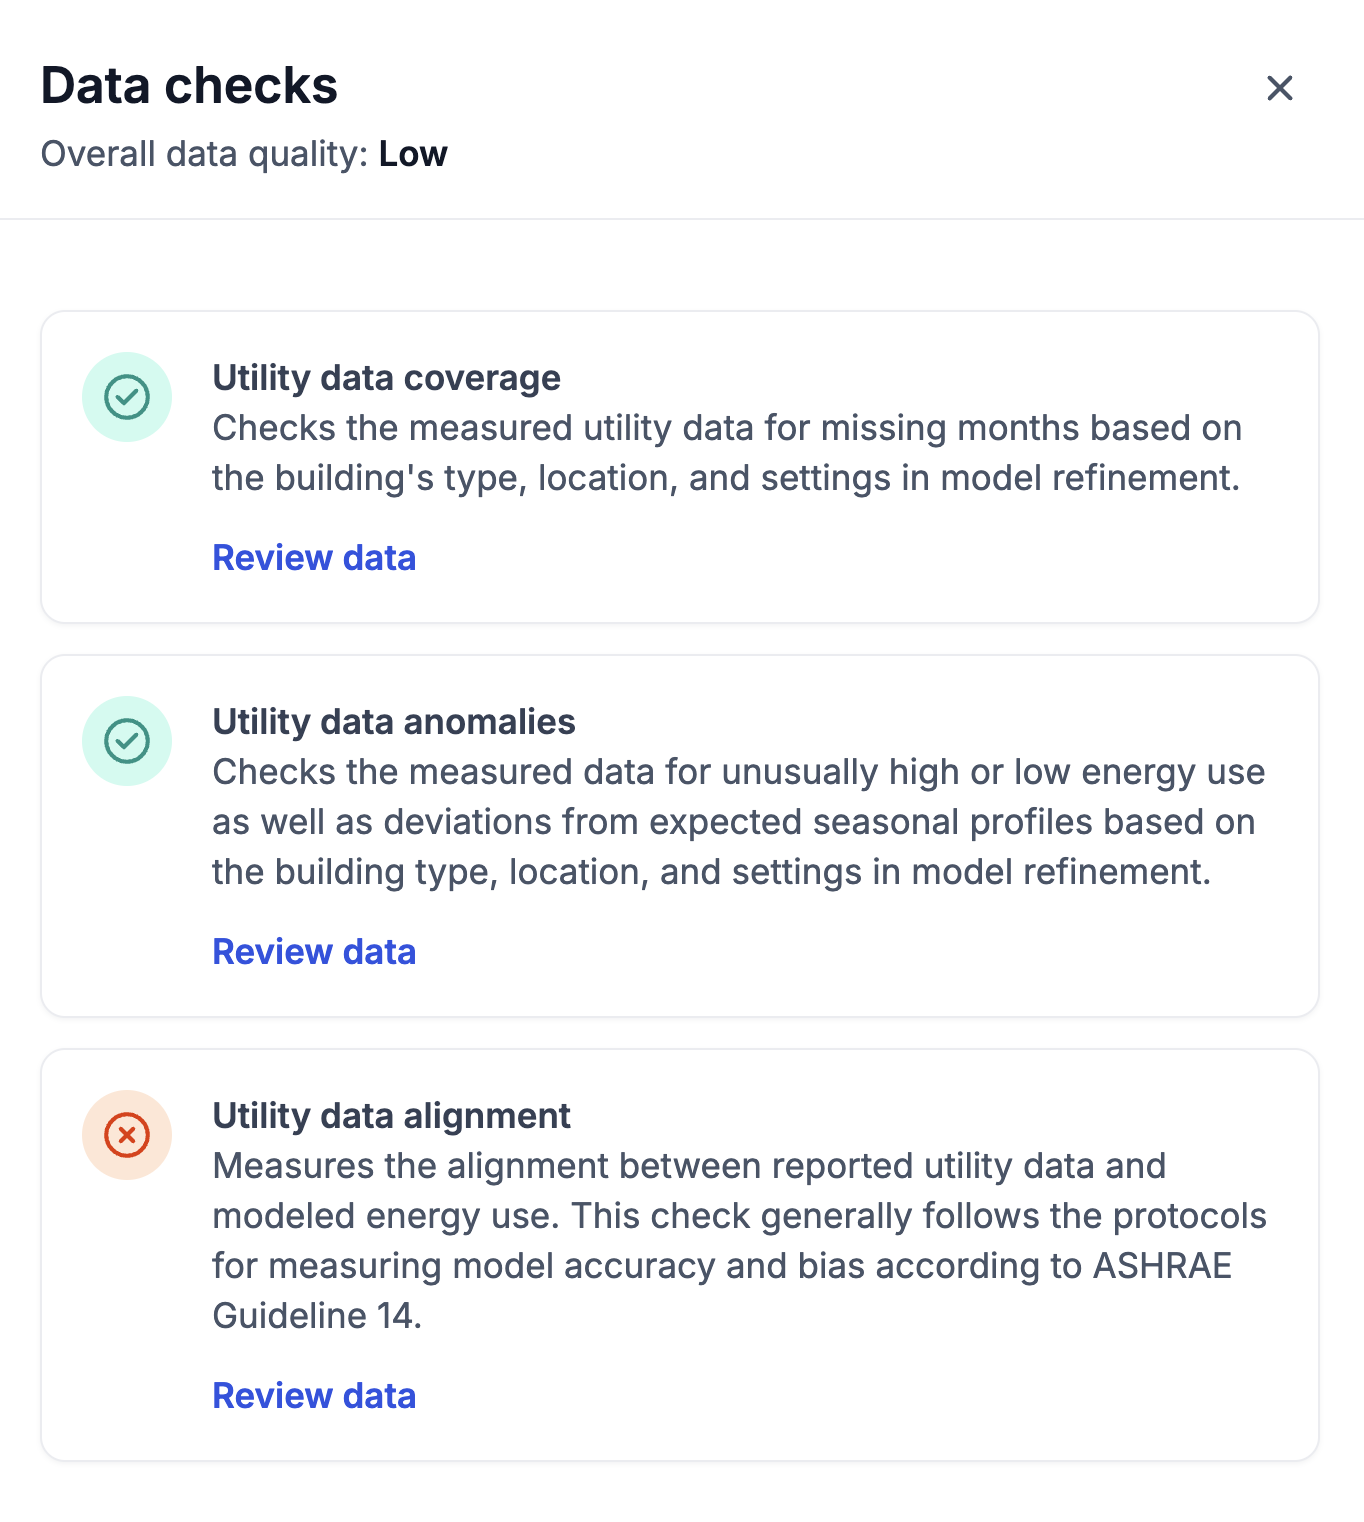
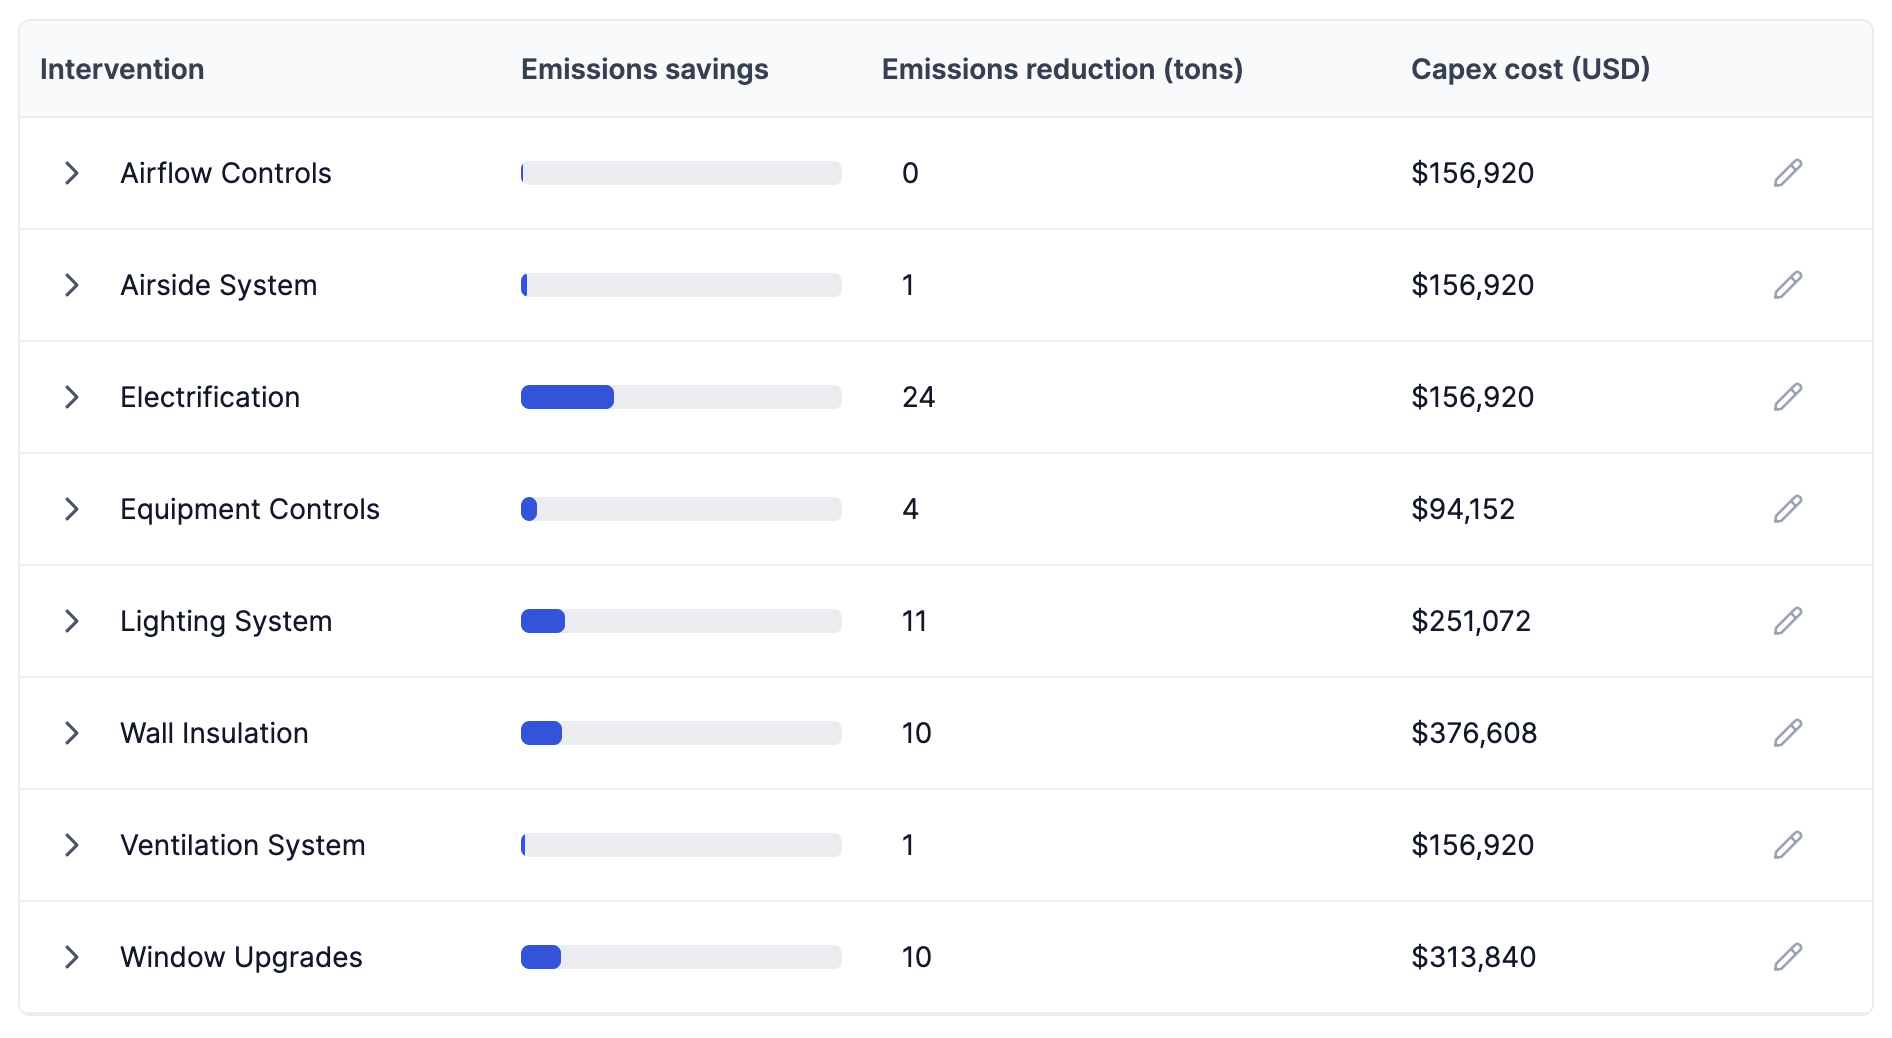
Each check contributes to an overall data quality score, making it easier to assess the reliability of building inputs at a glance. When issues are detected, users can drill directly into the underlying utility data to review flagged records and make corrections as necessary.
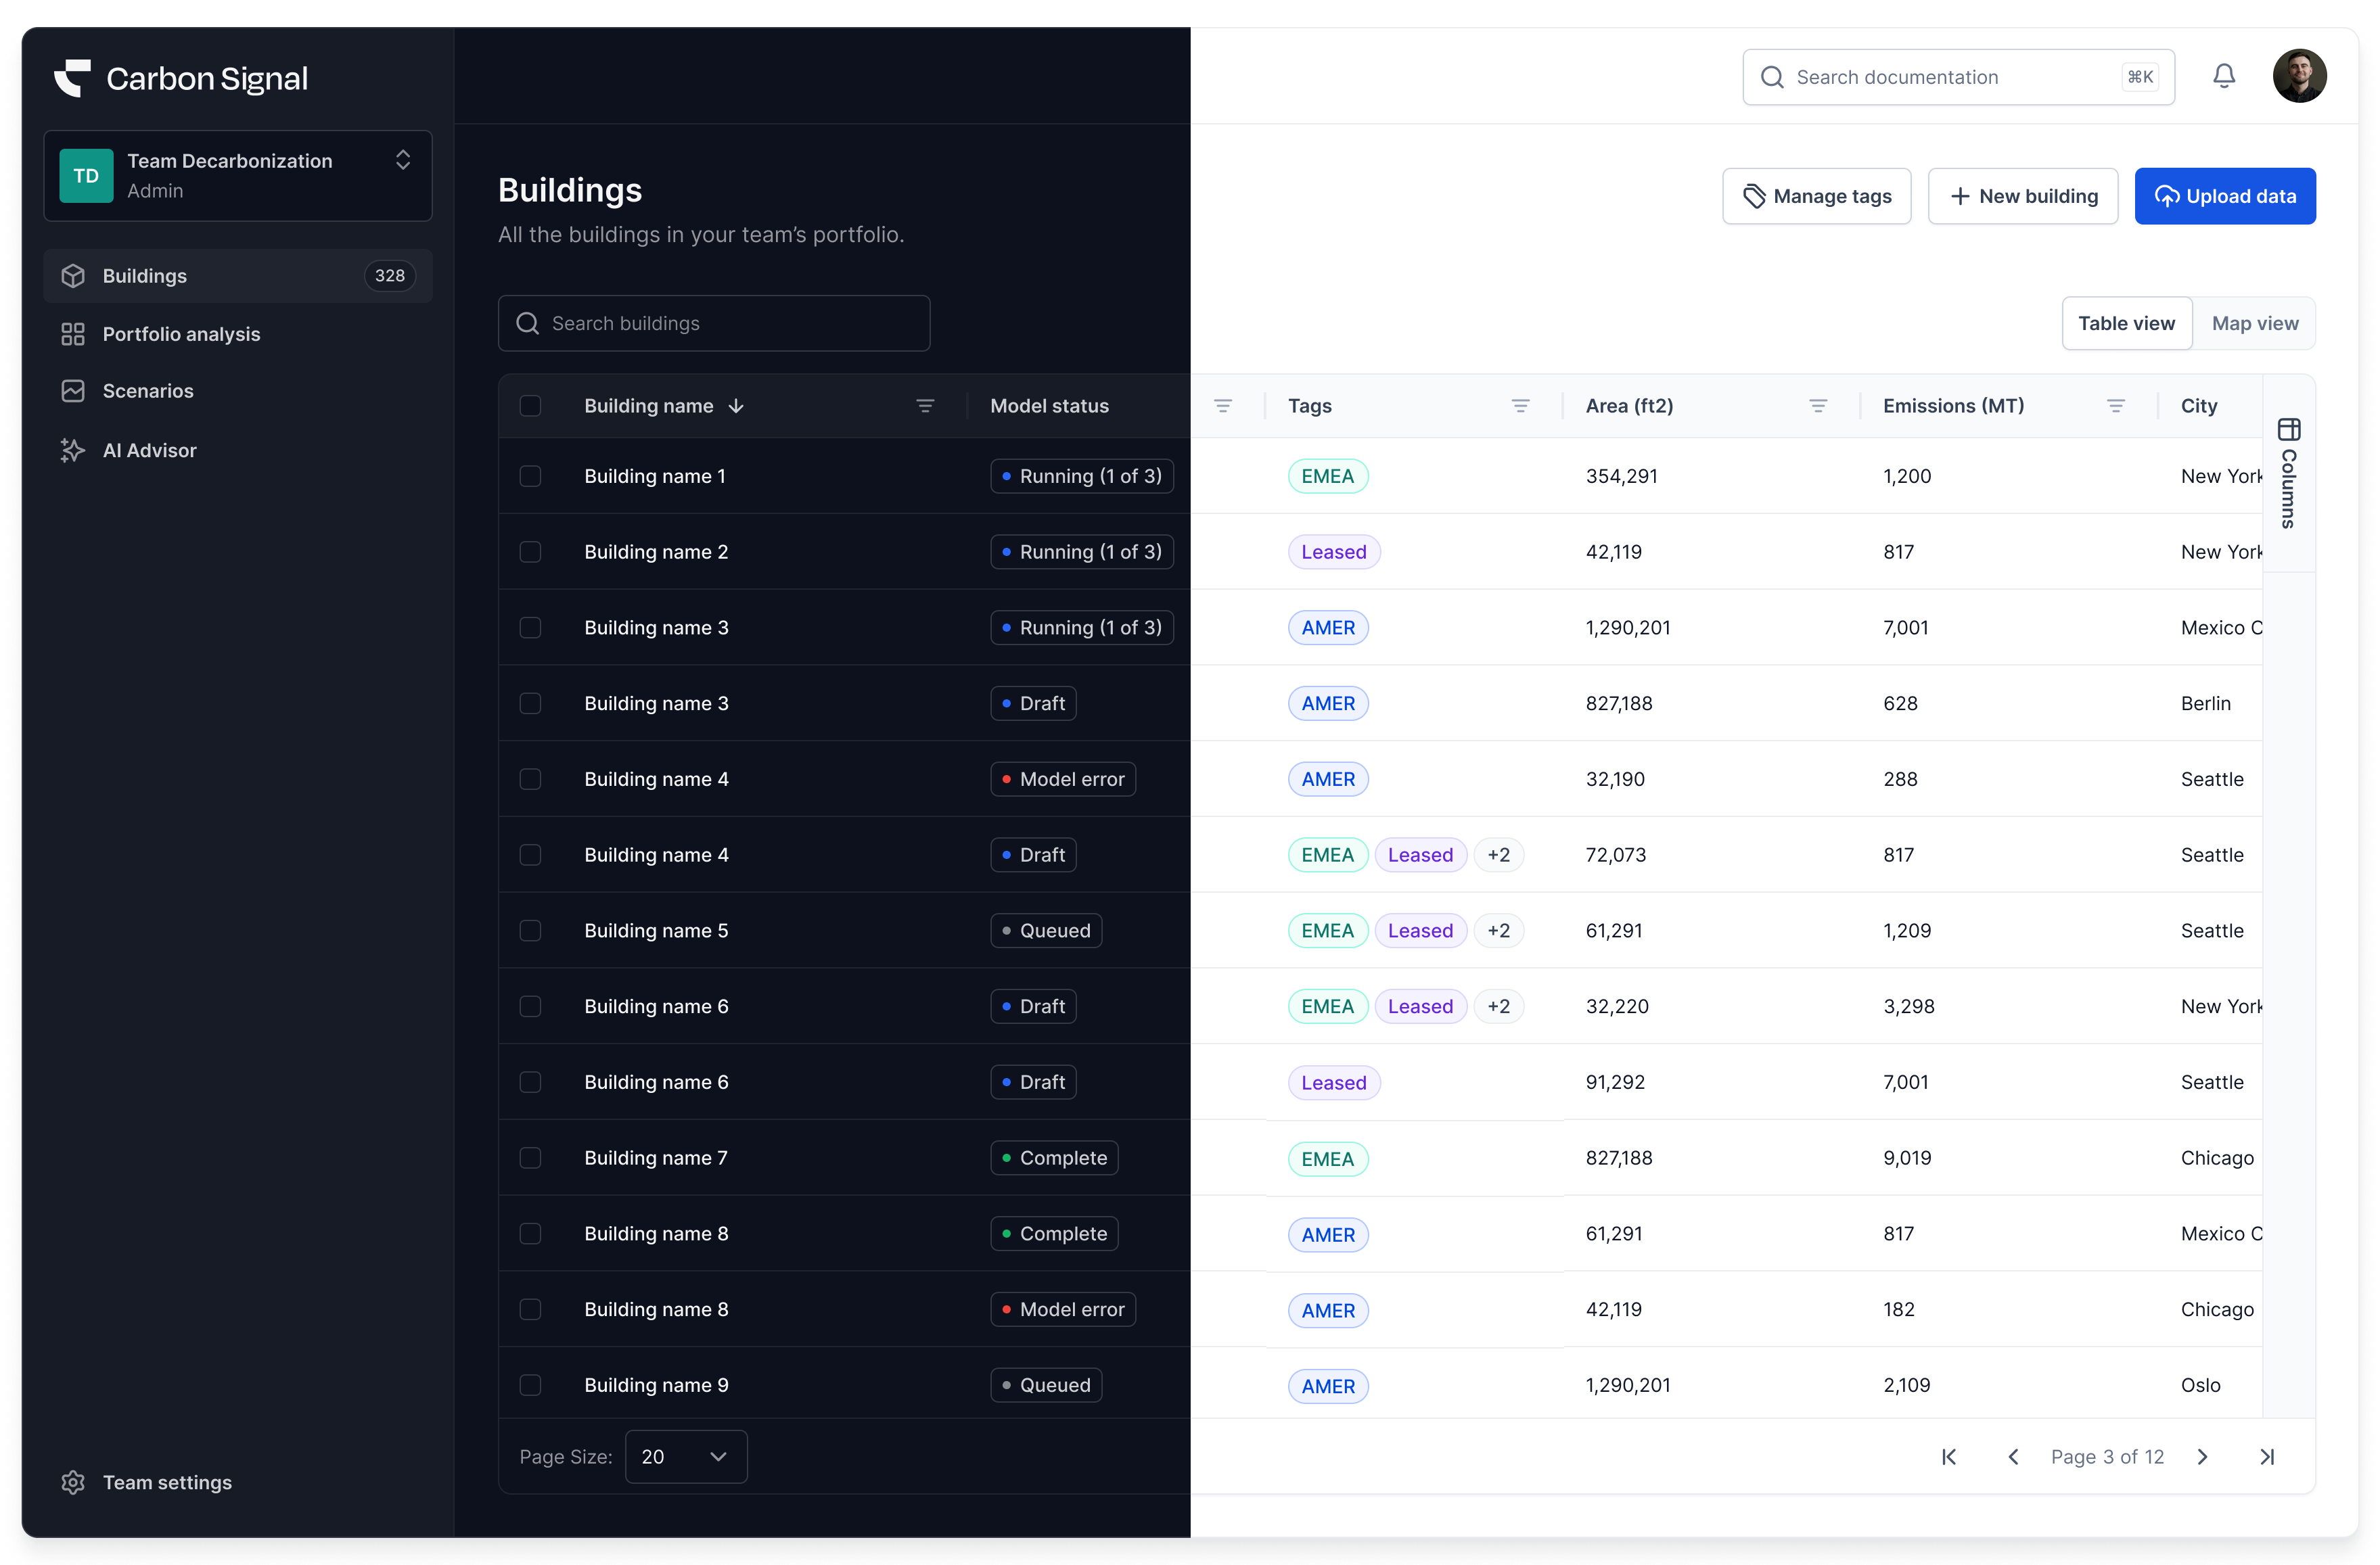
New Energy Model Workspace
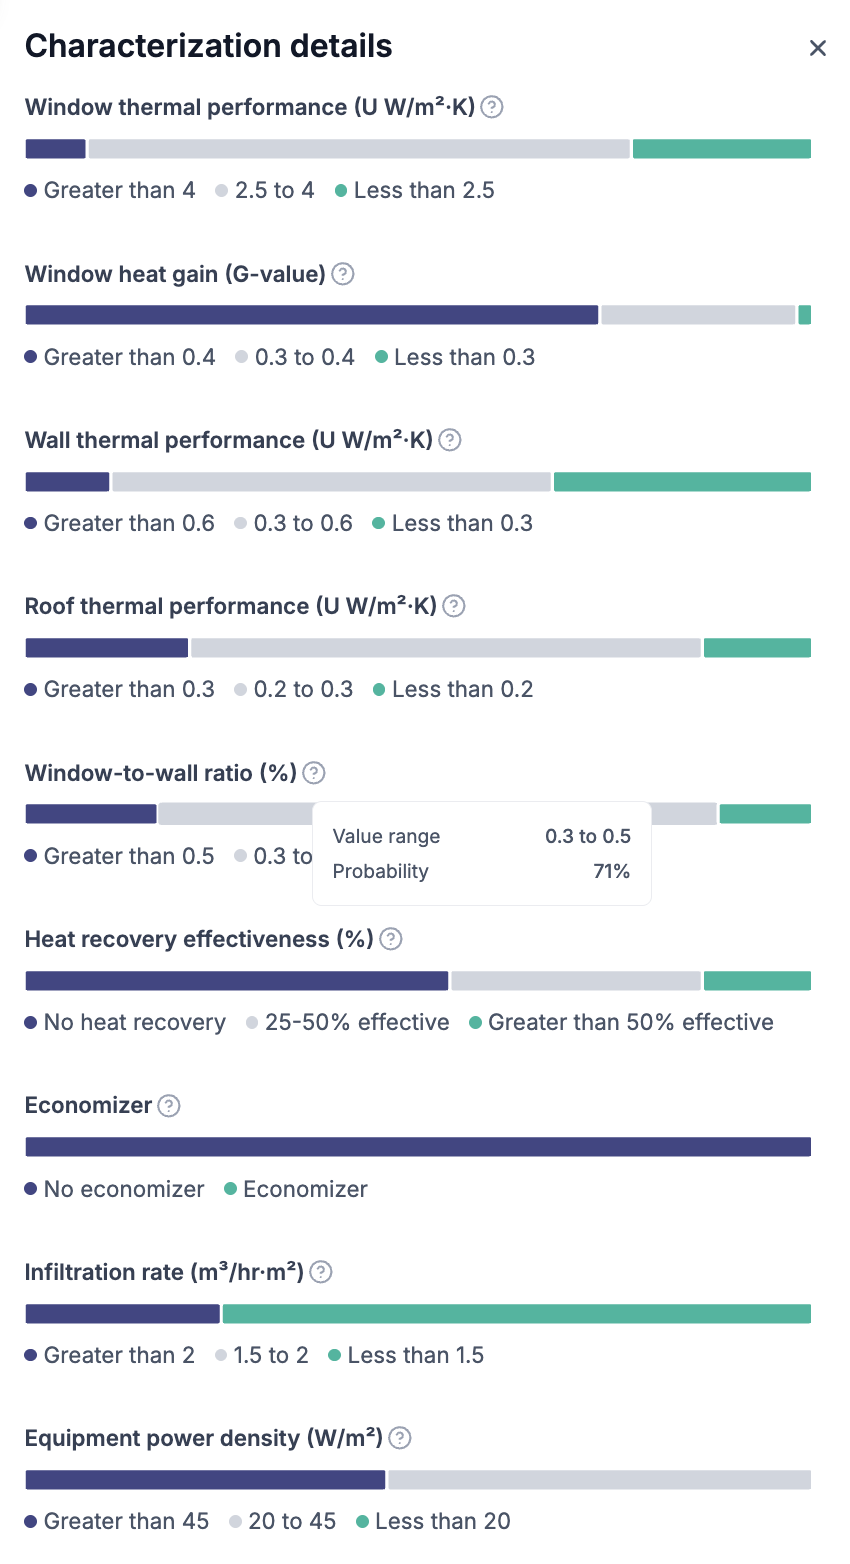
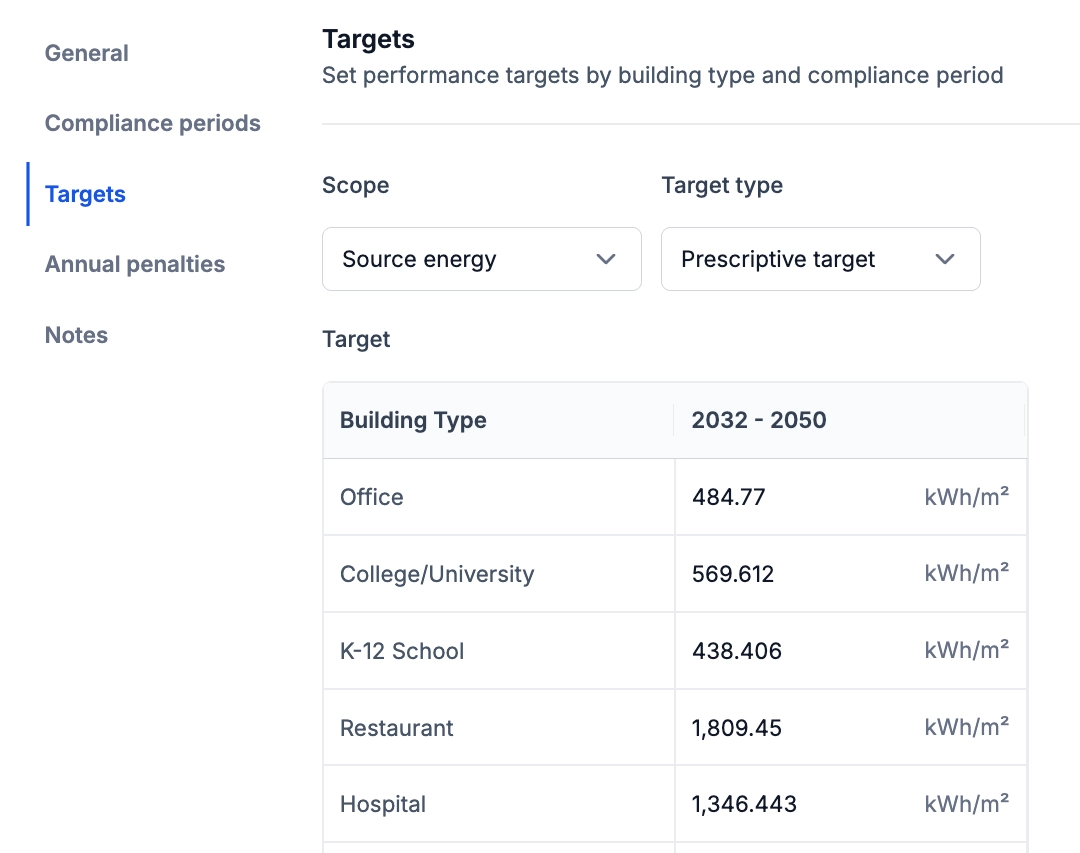
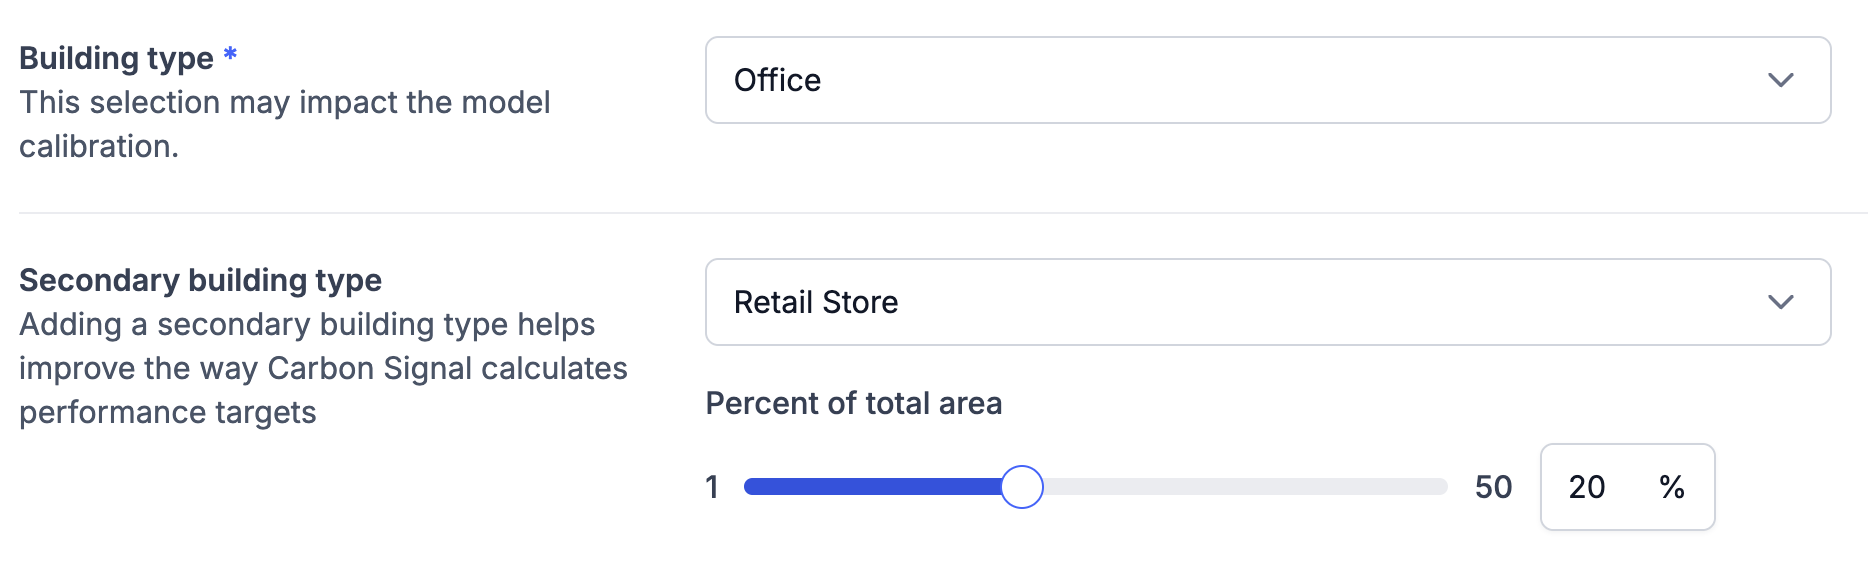
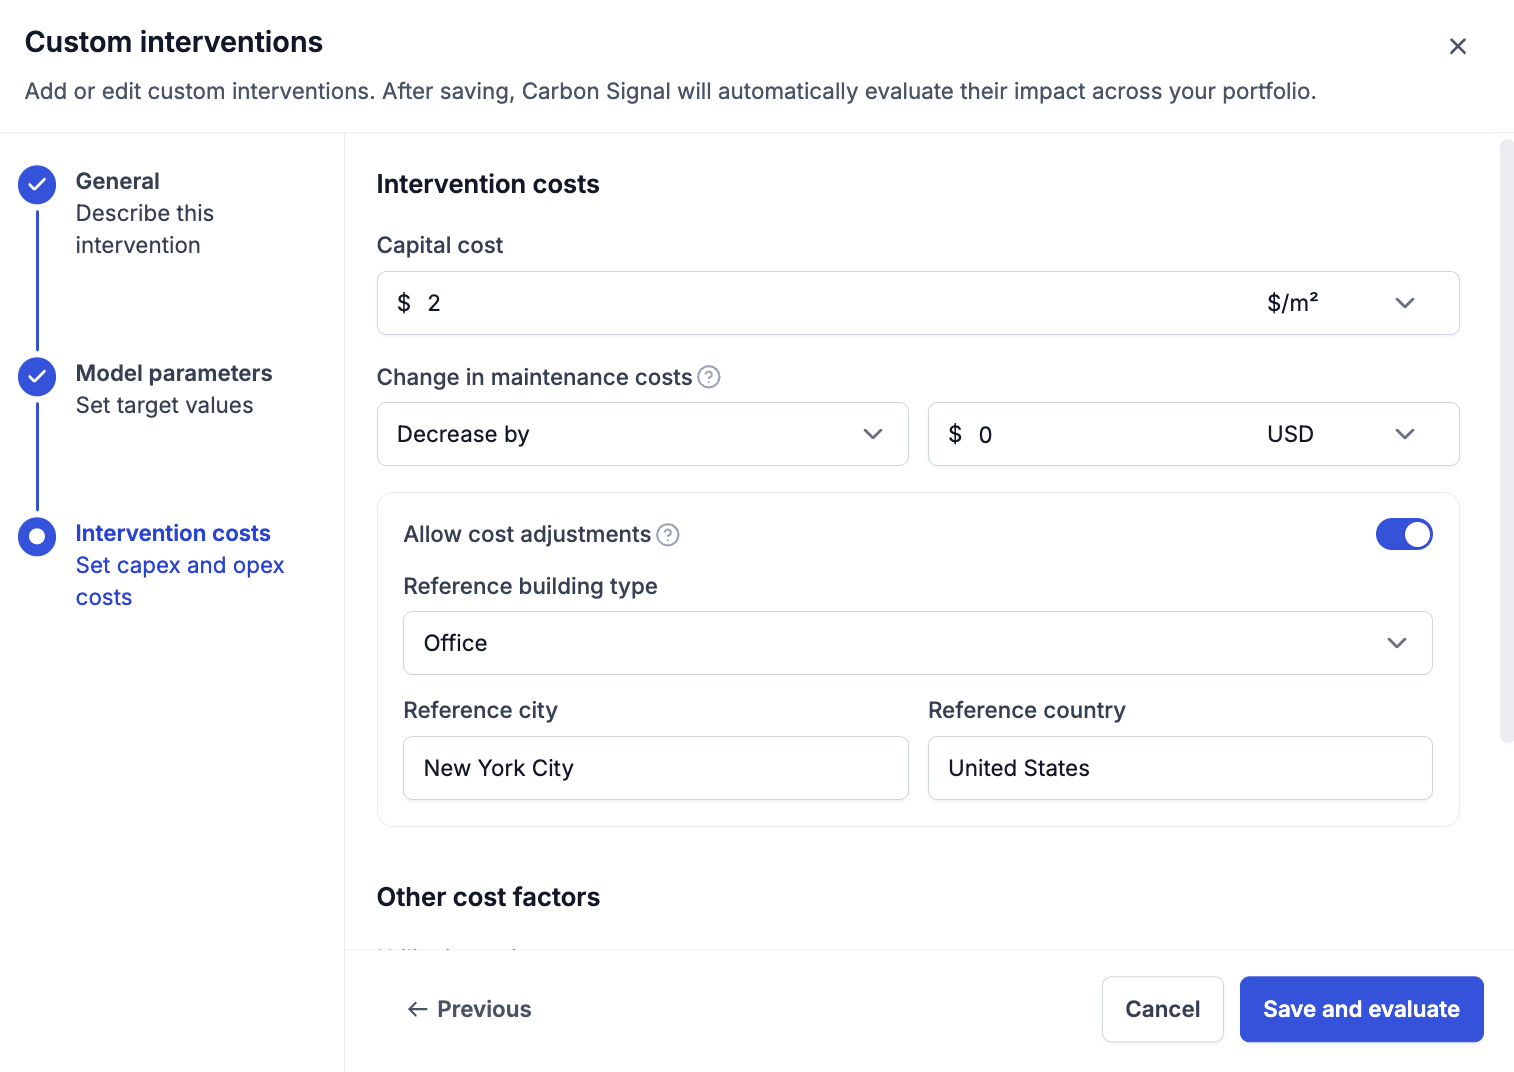
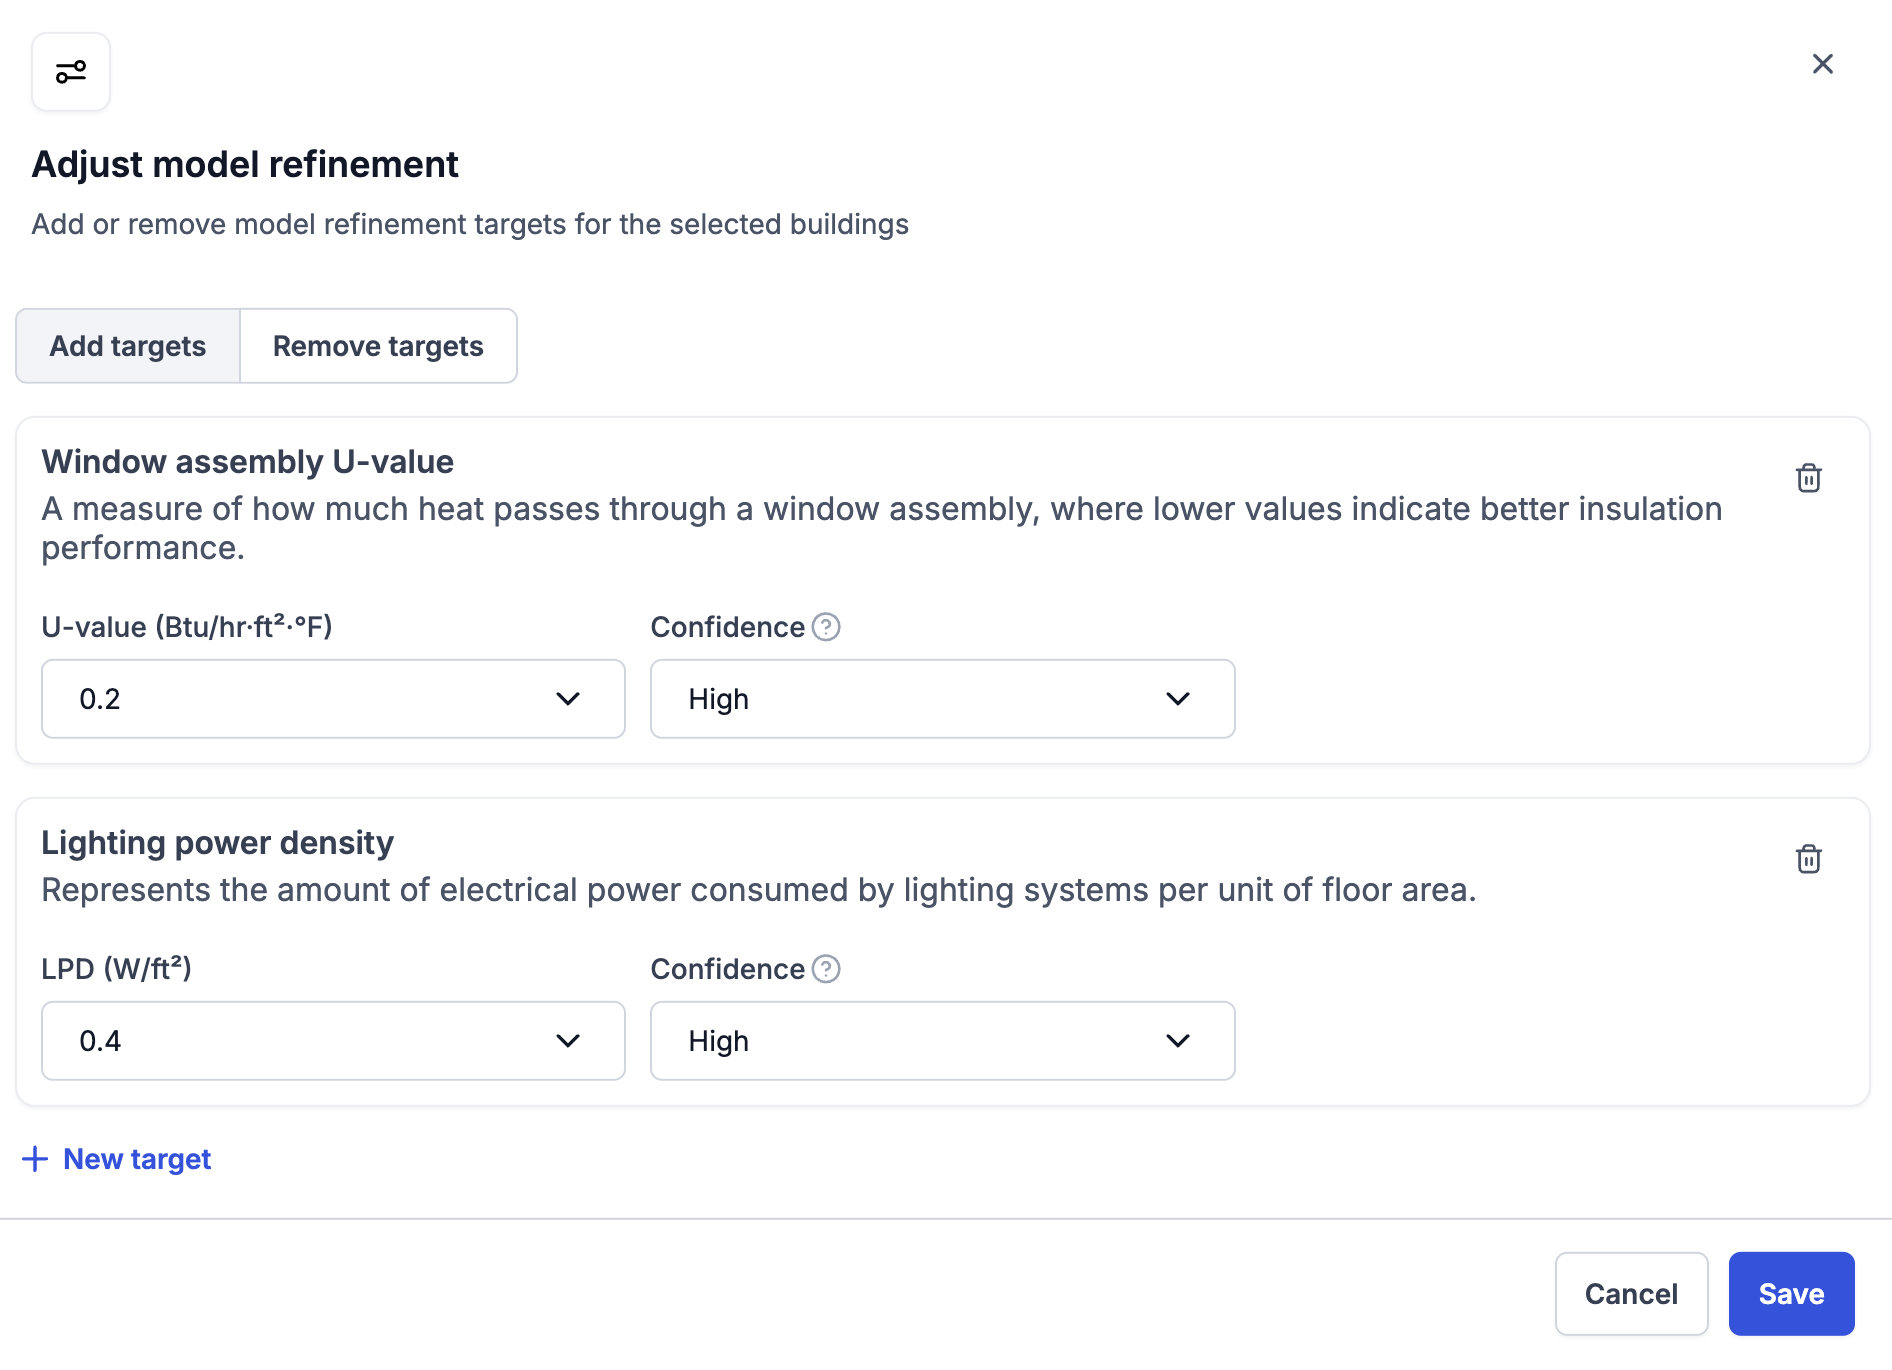
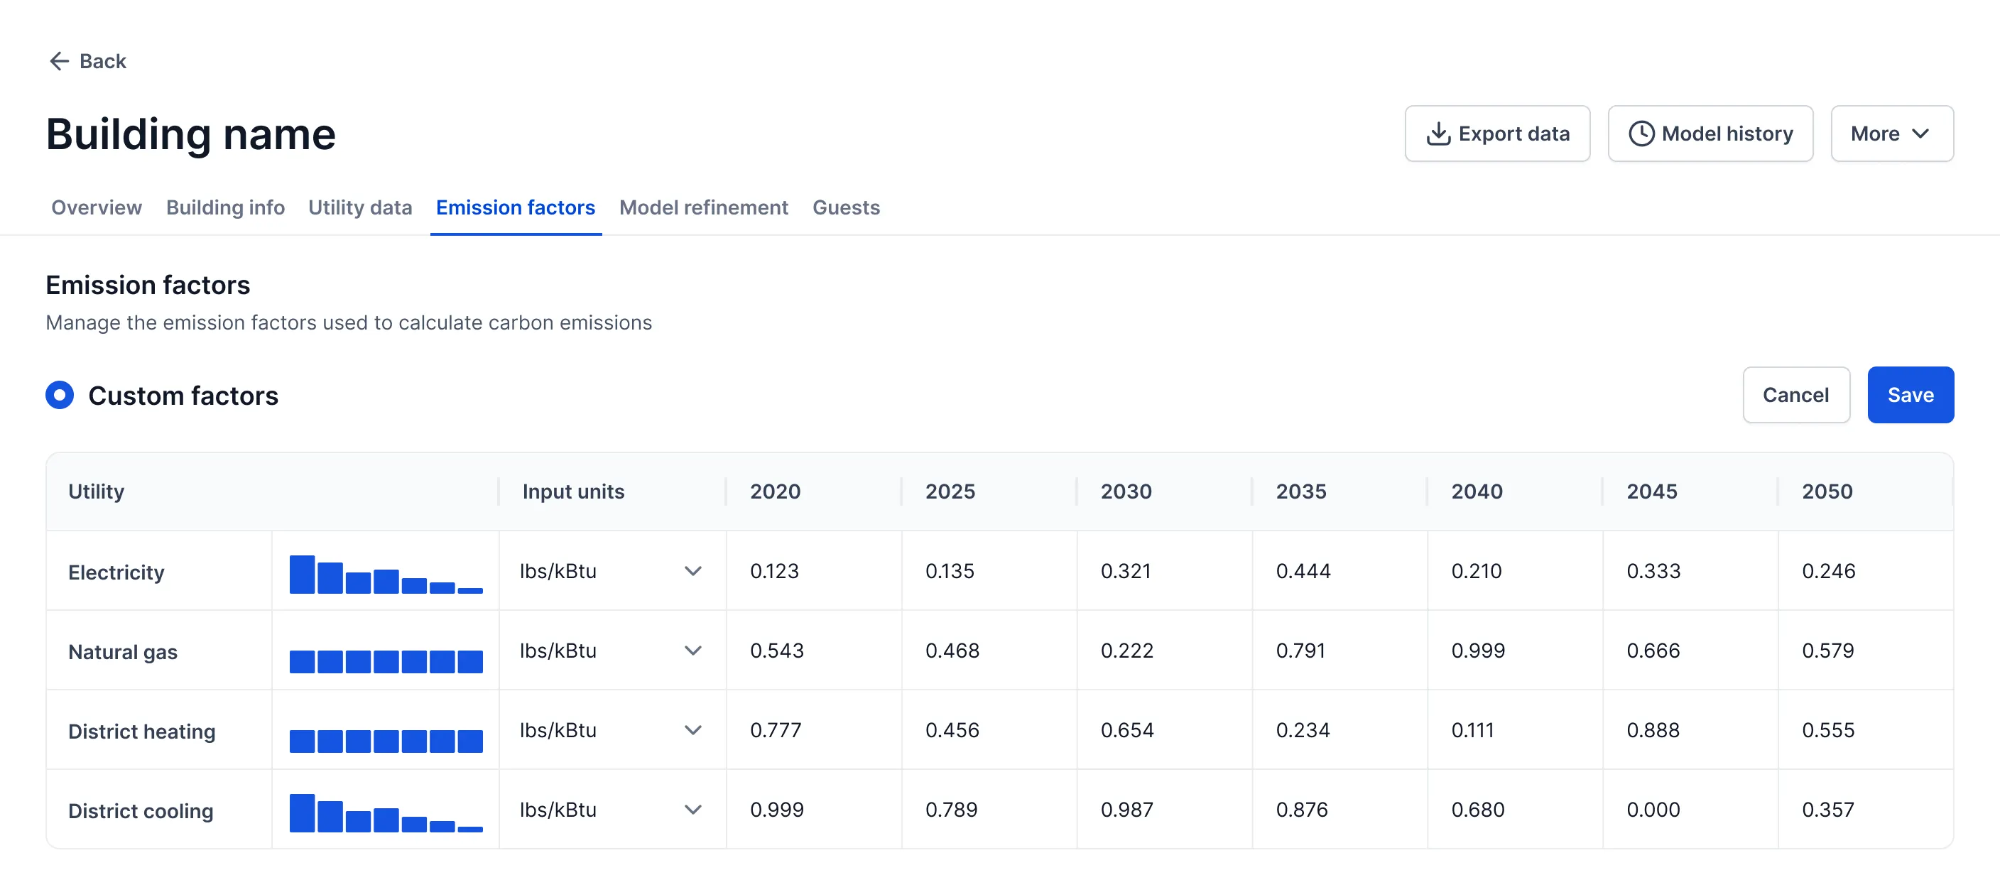
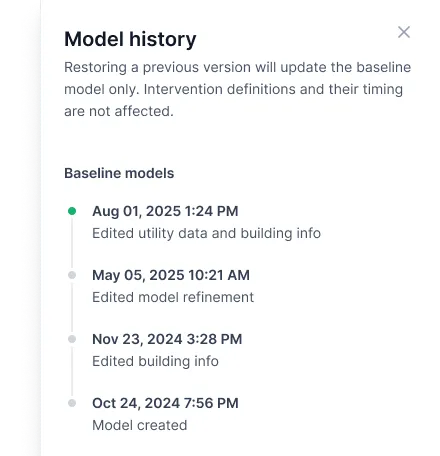
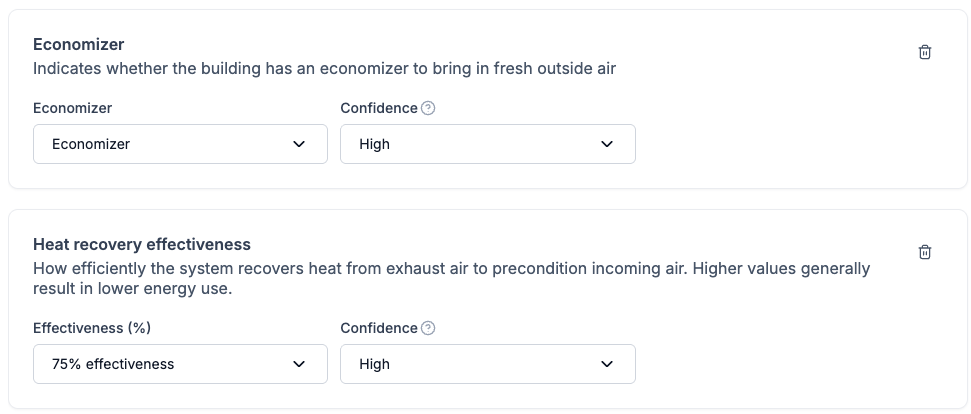
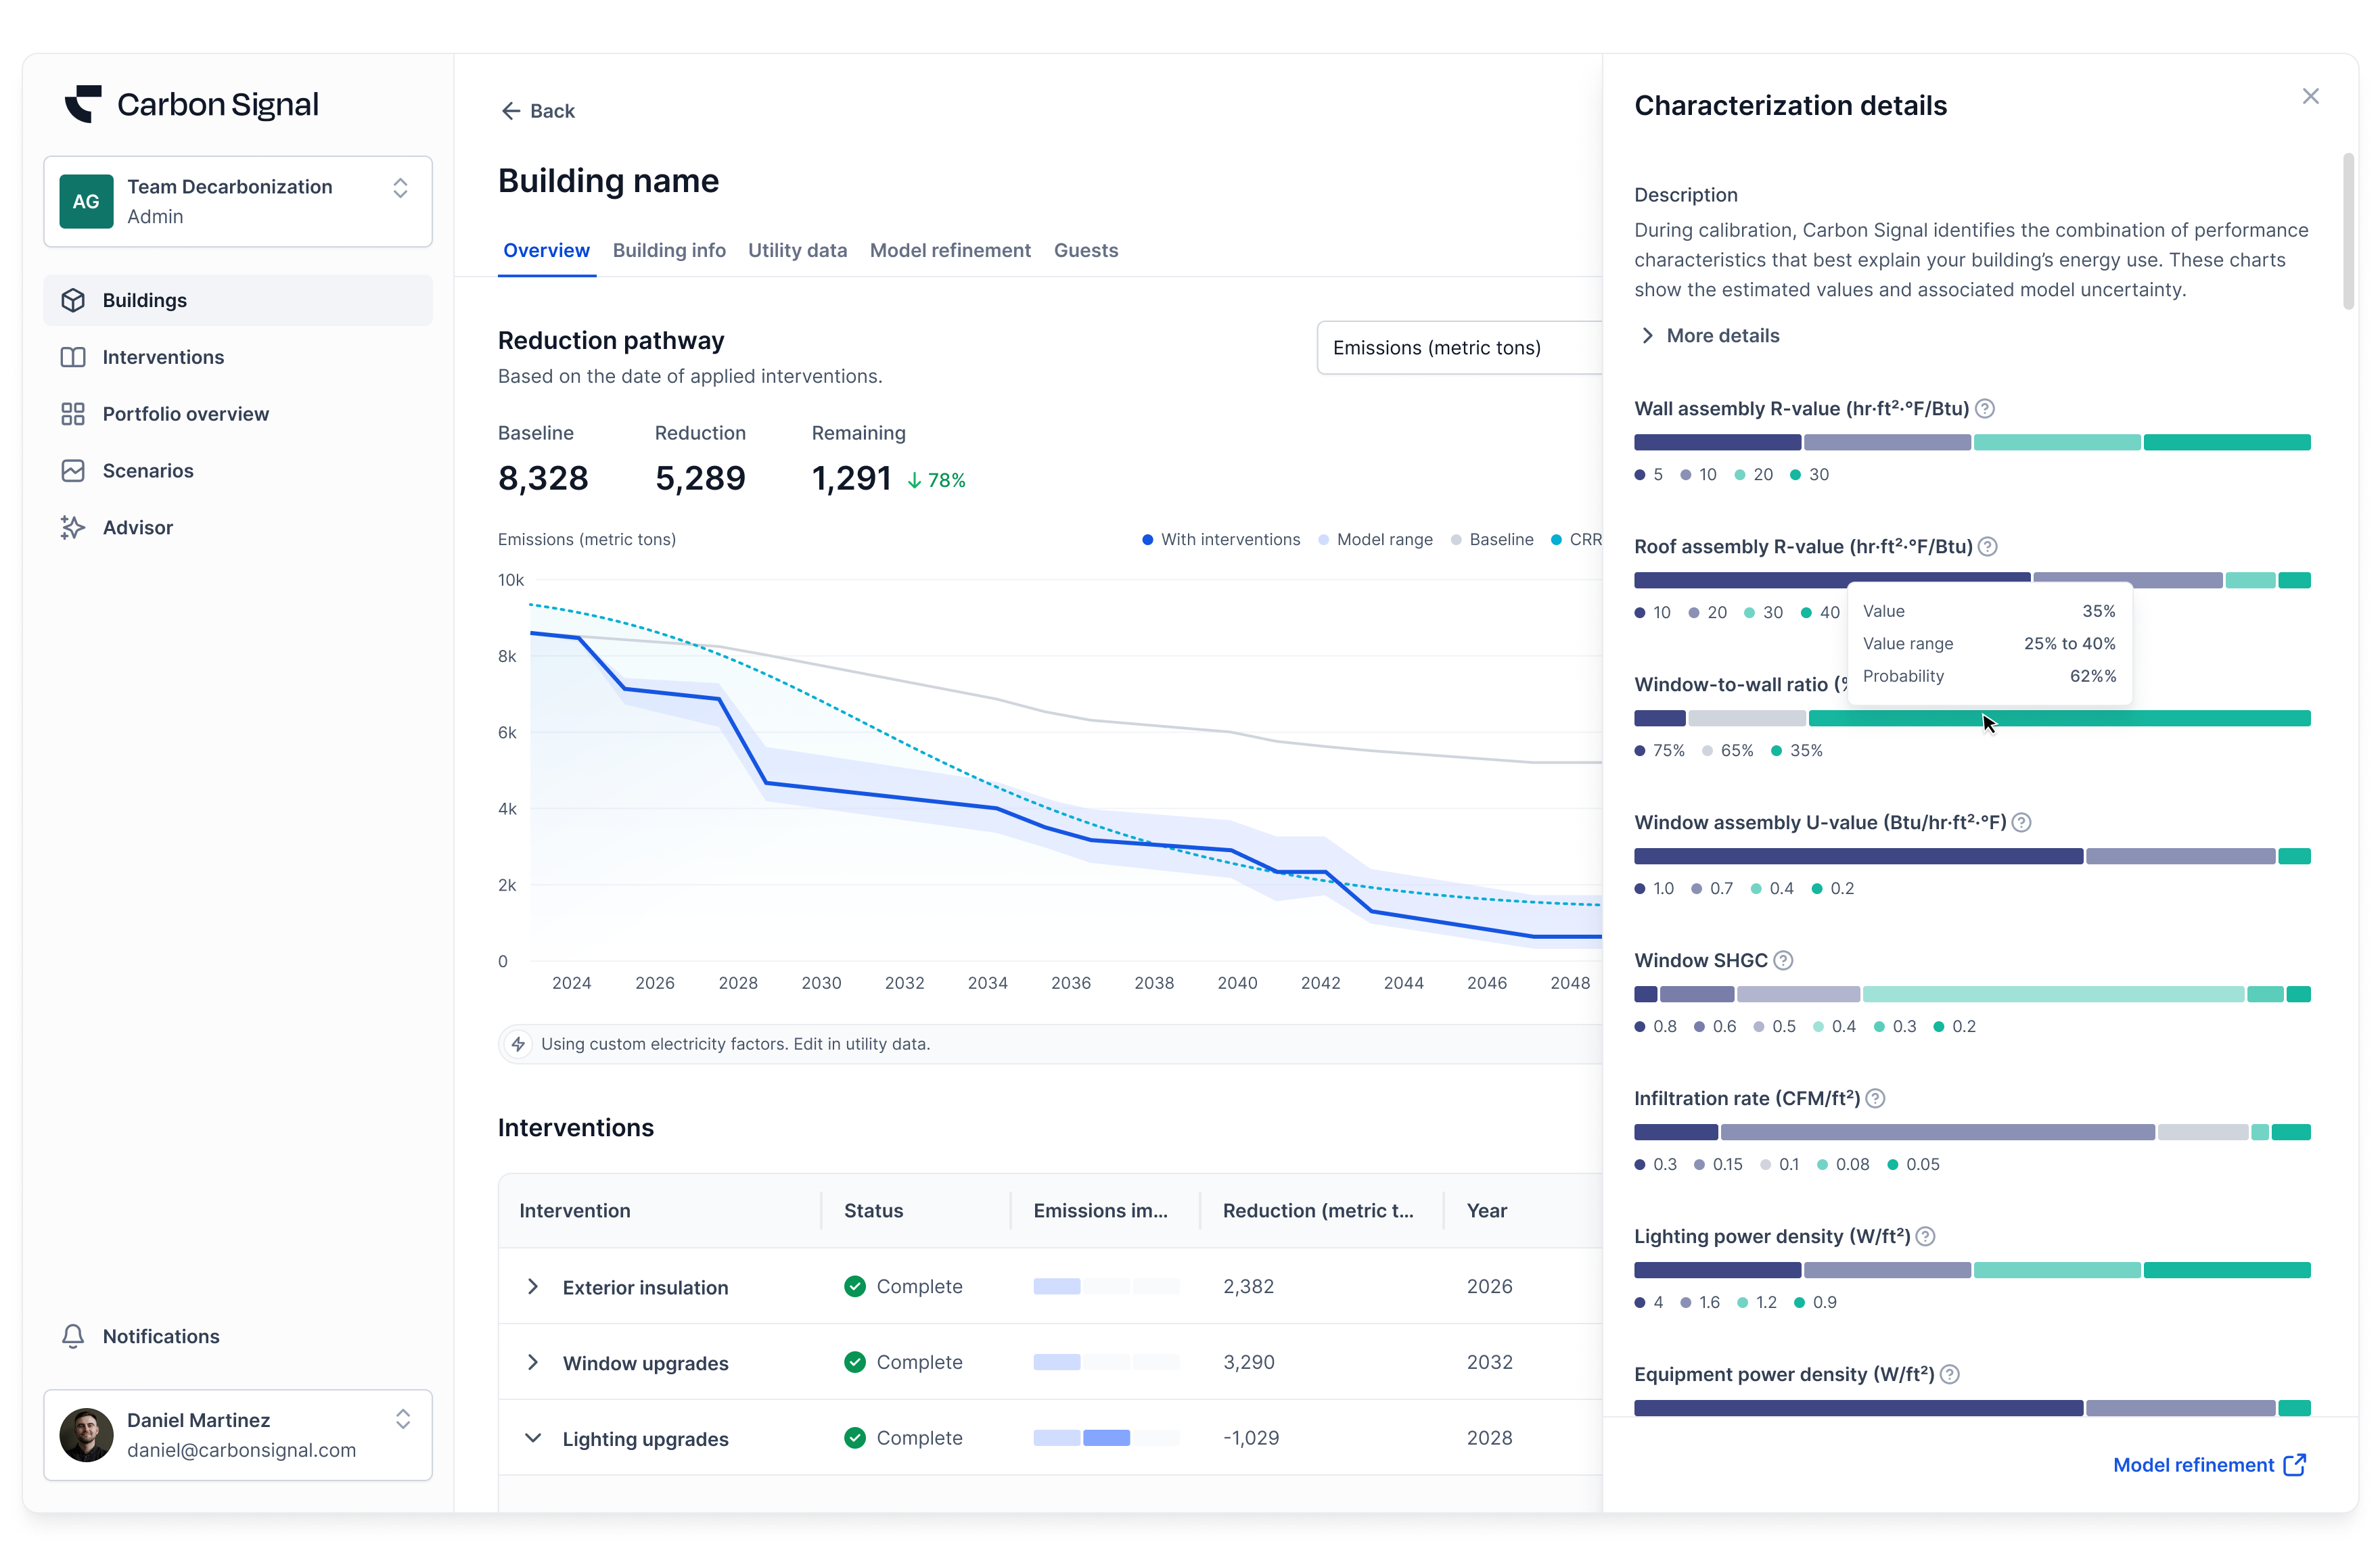
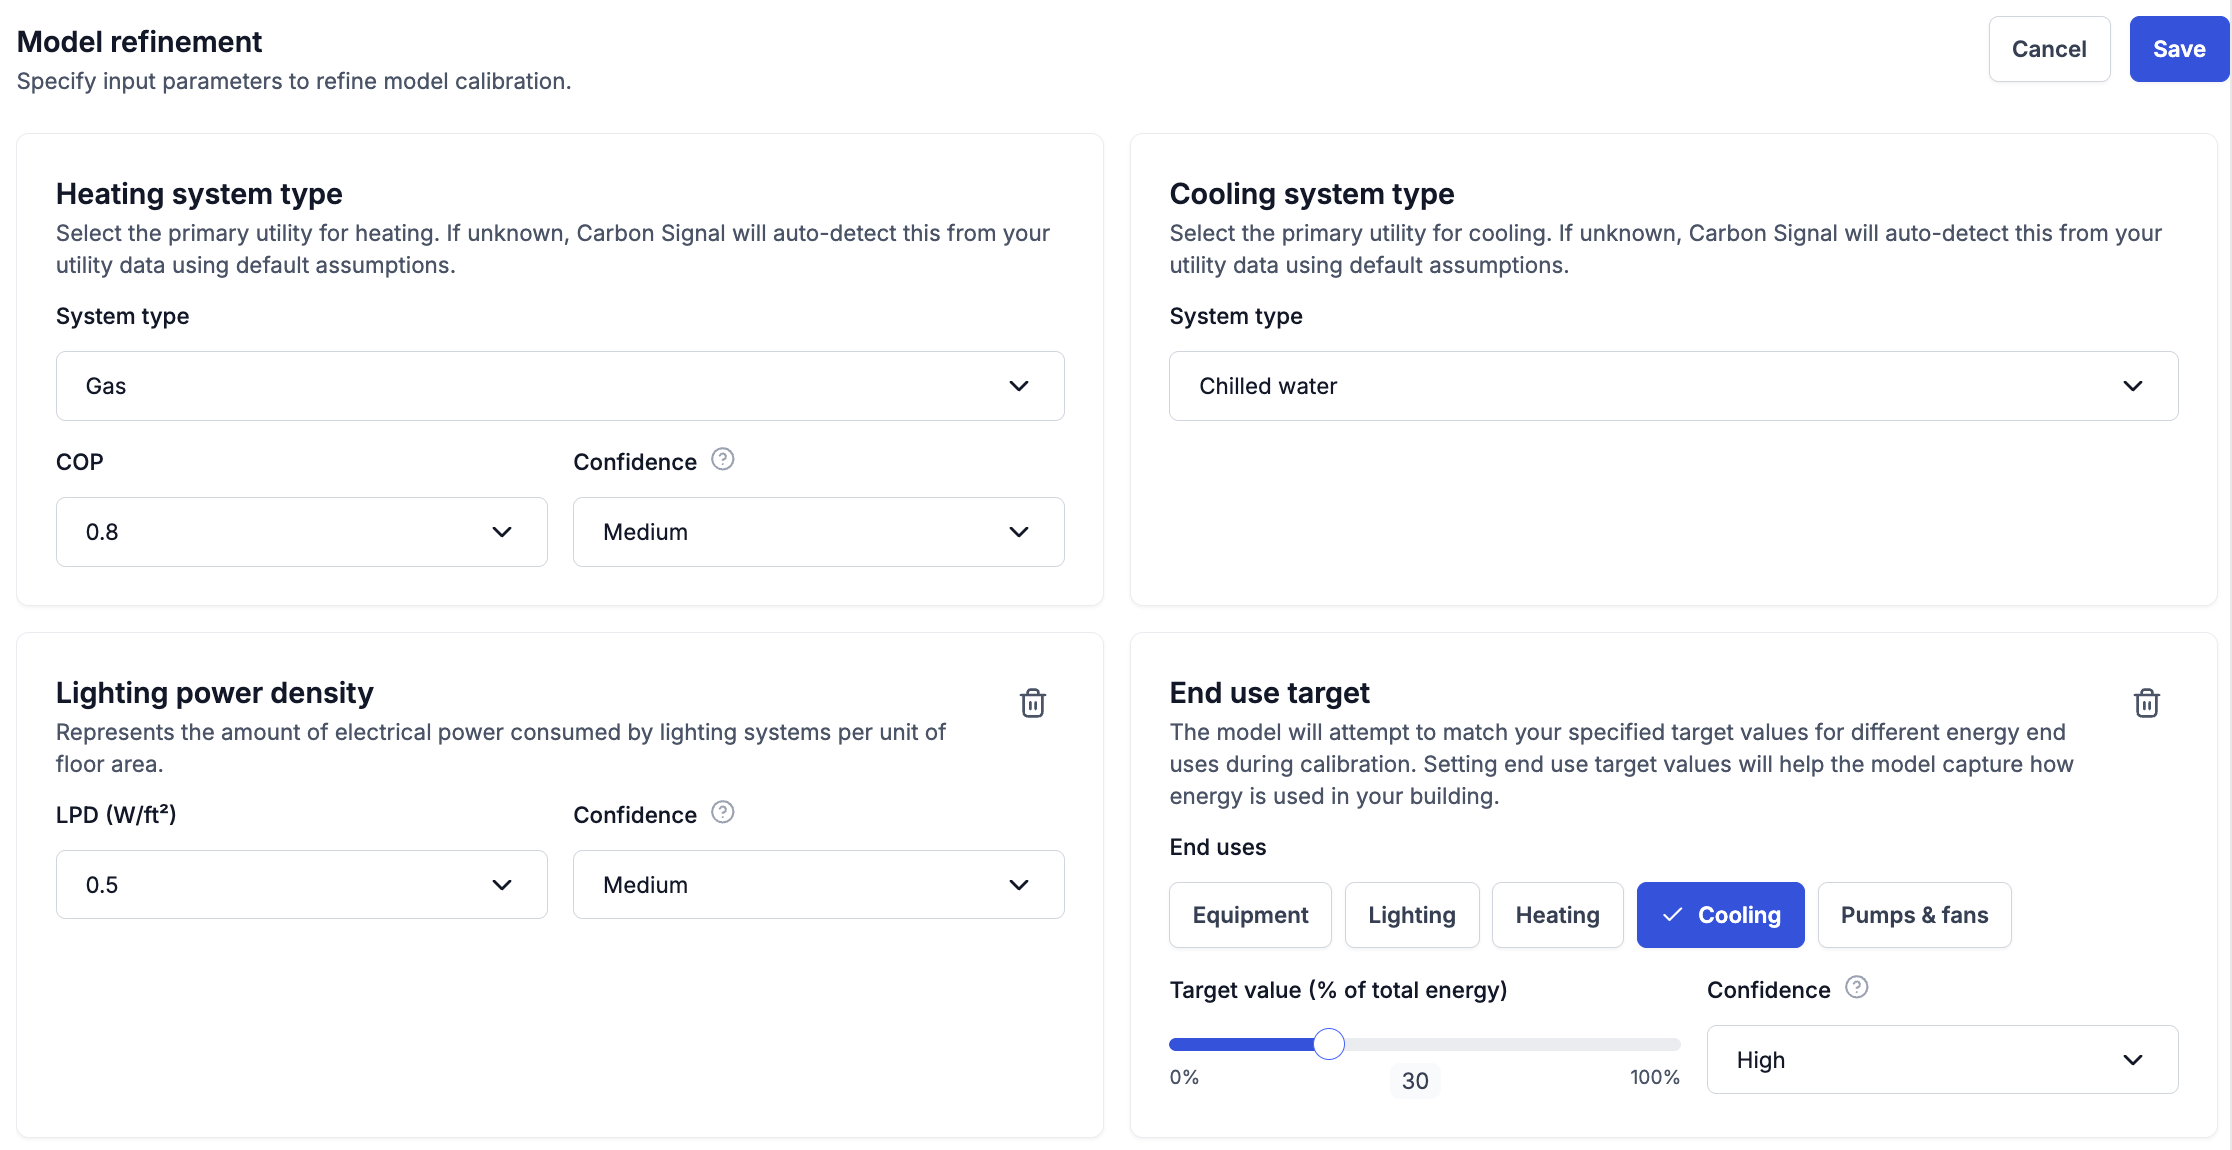
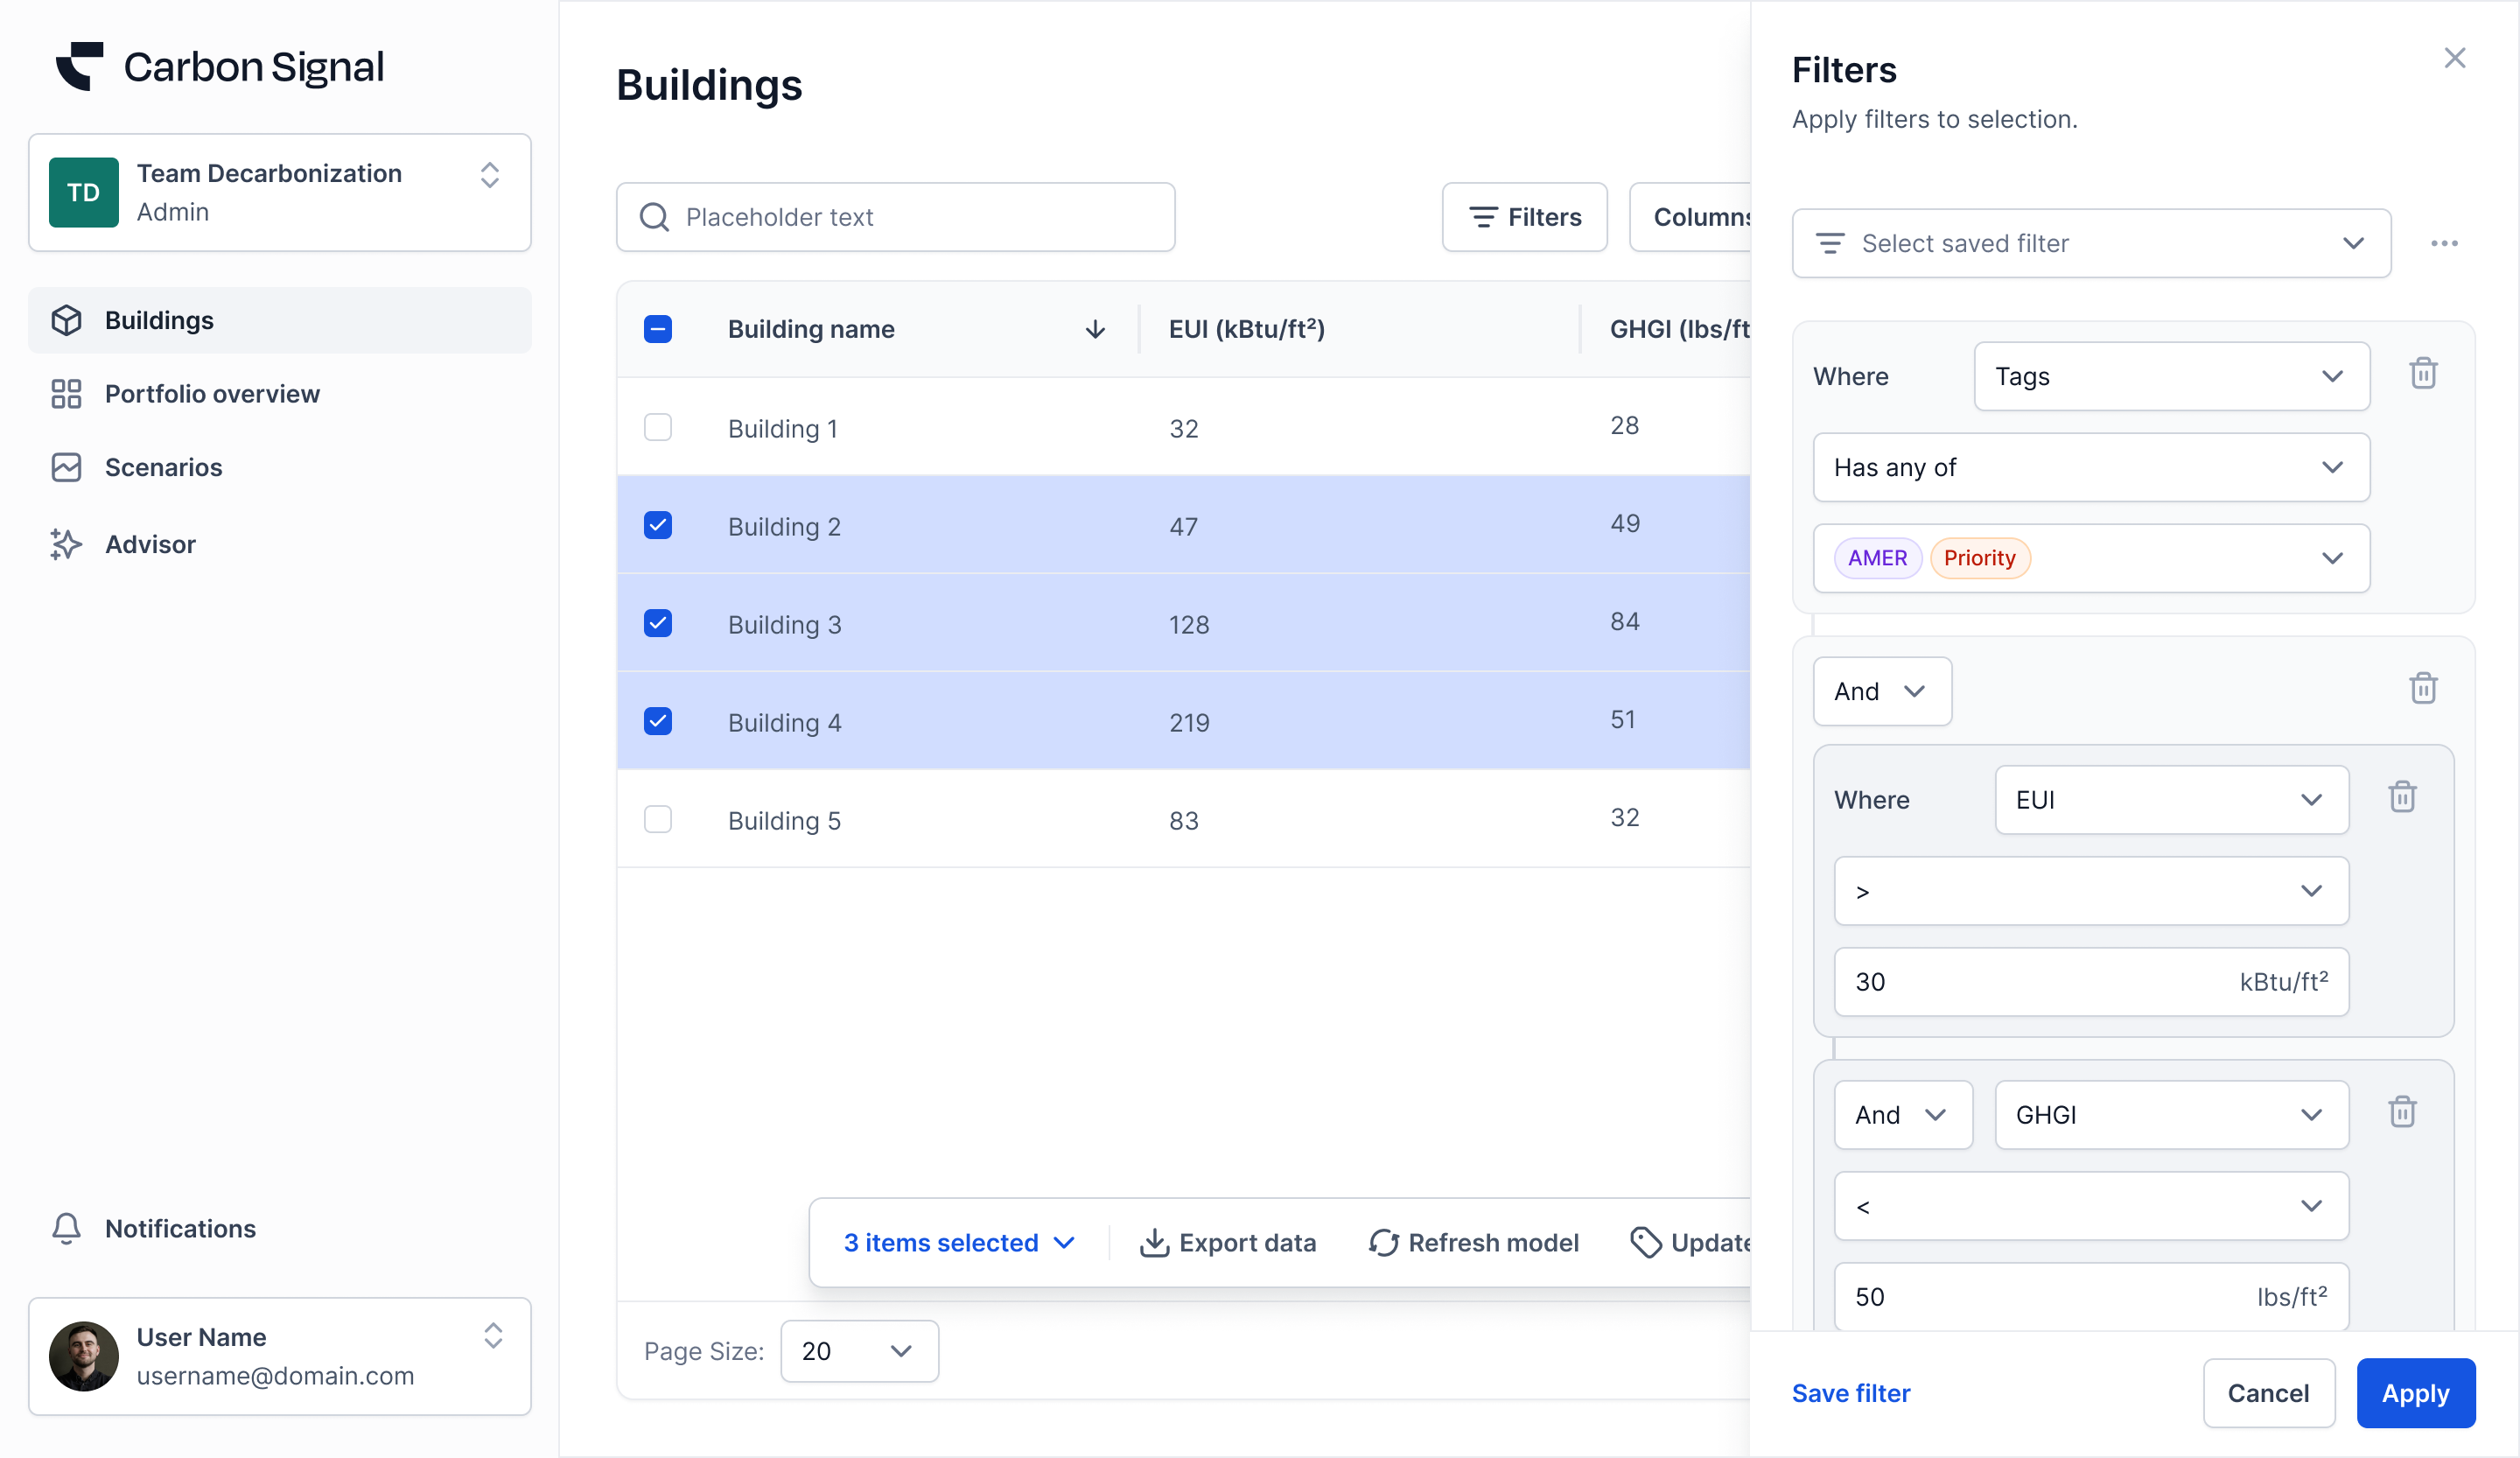
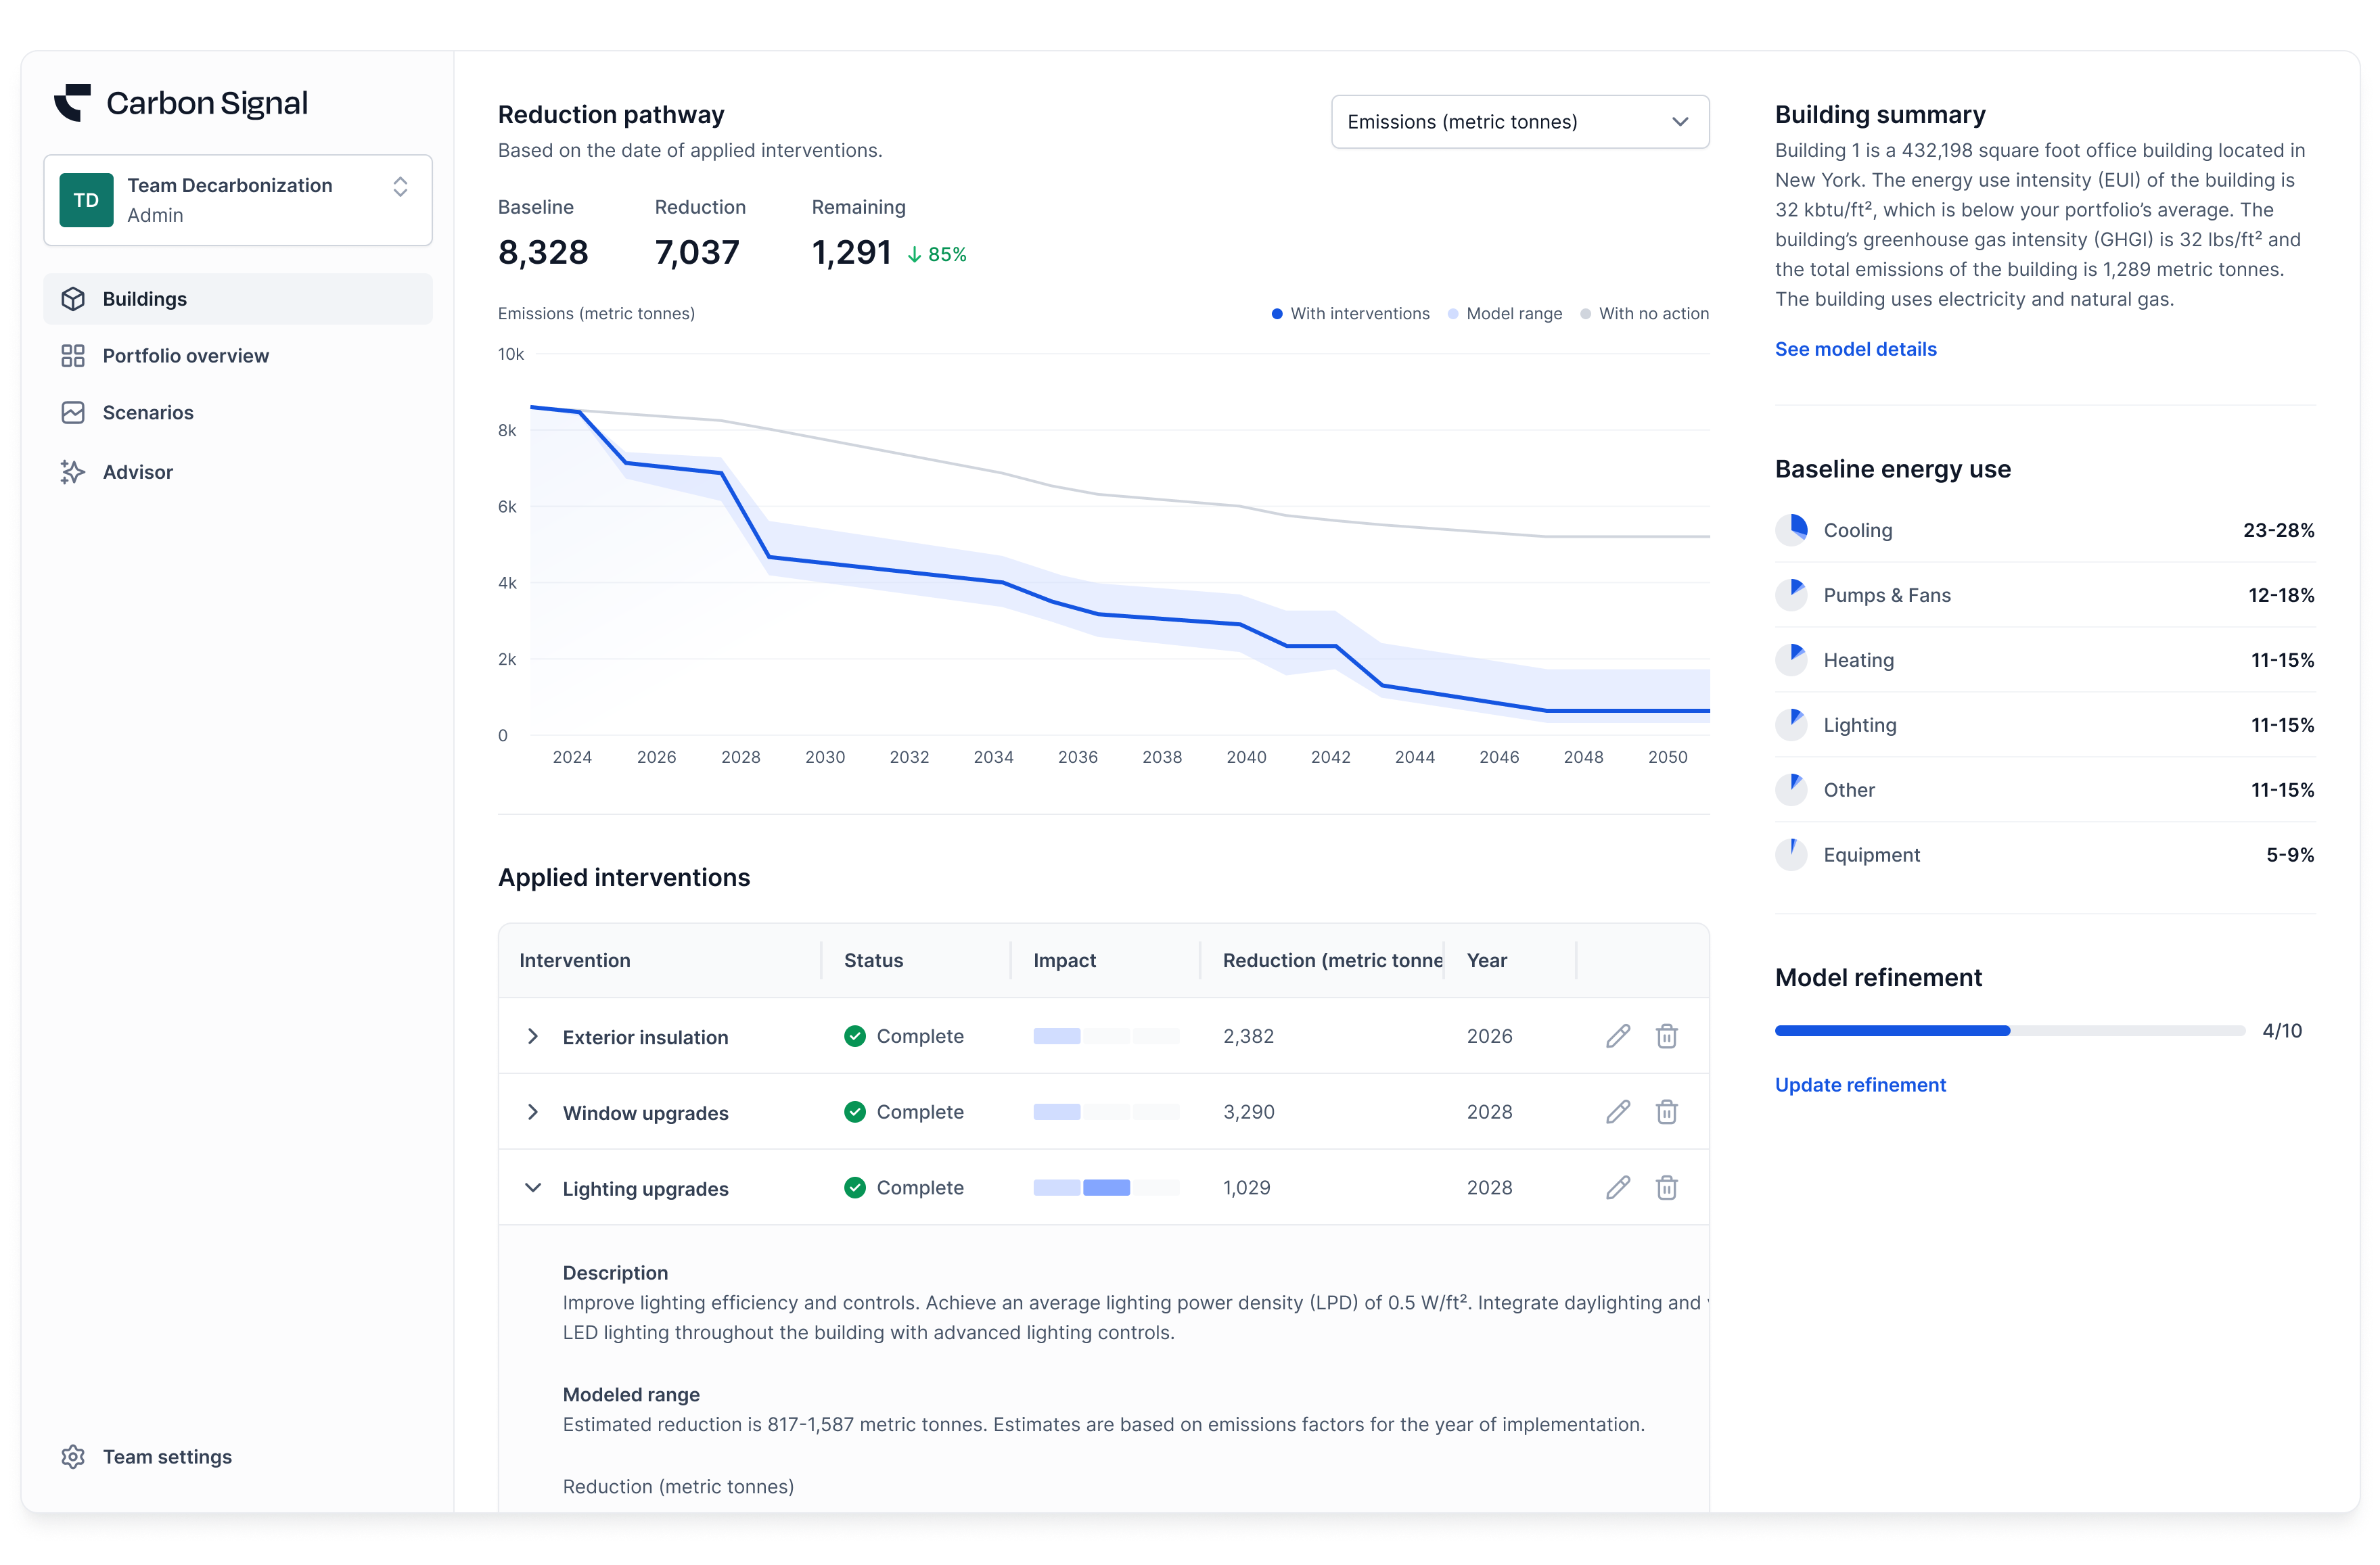
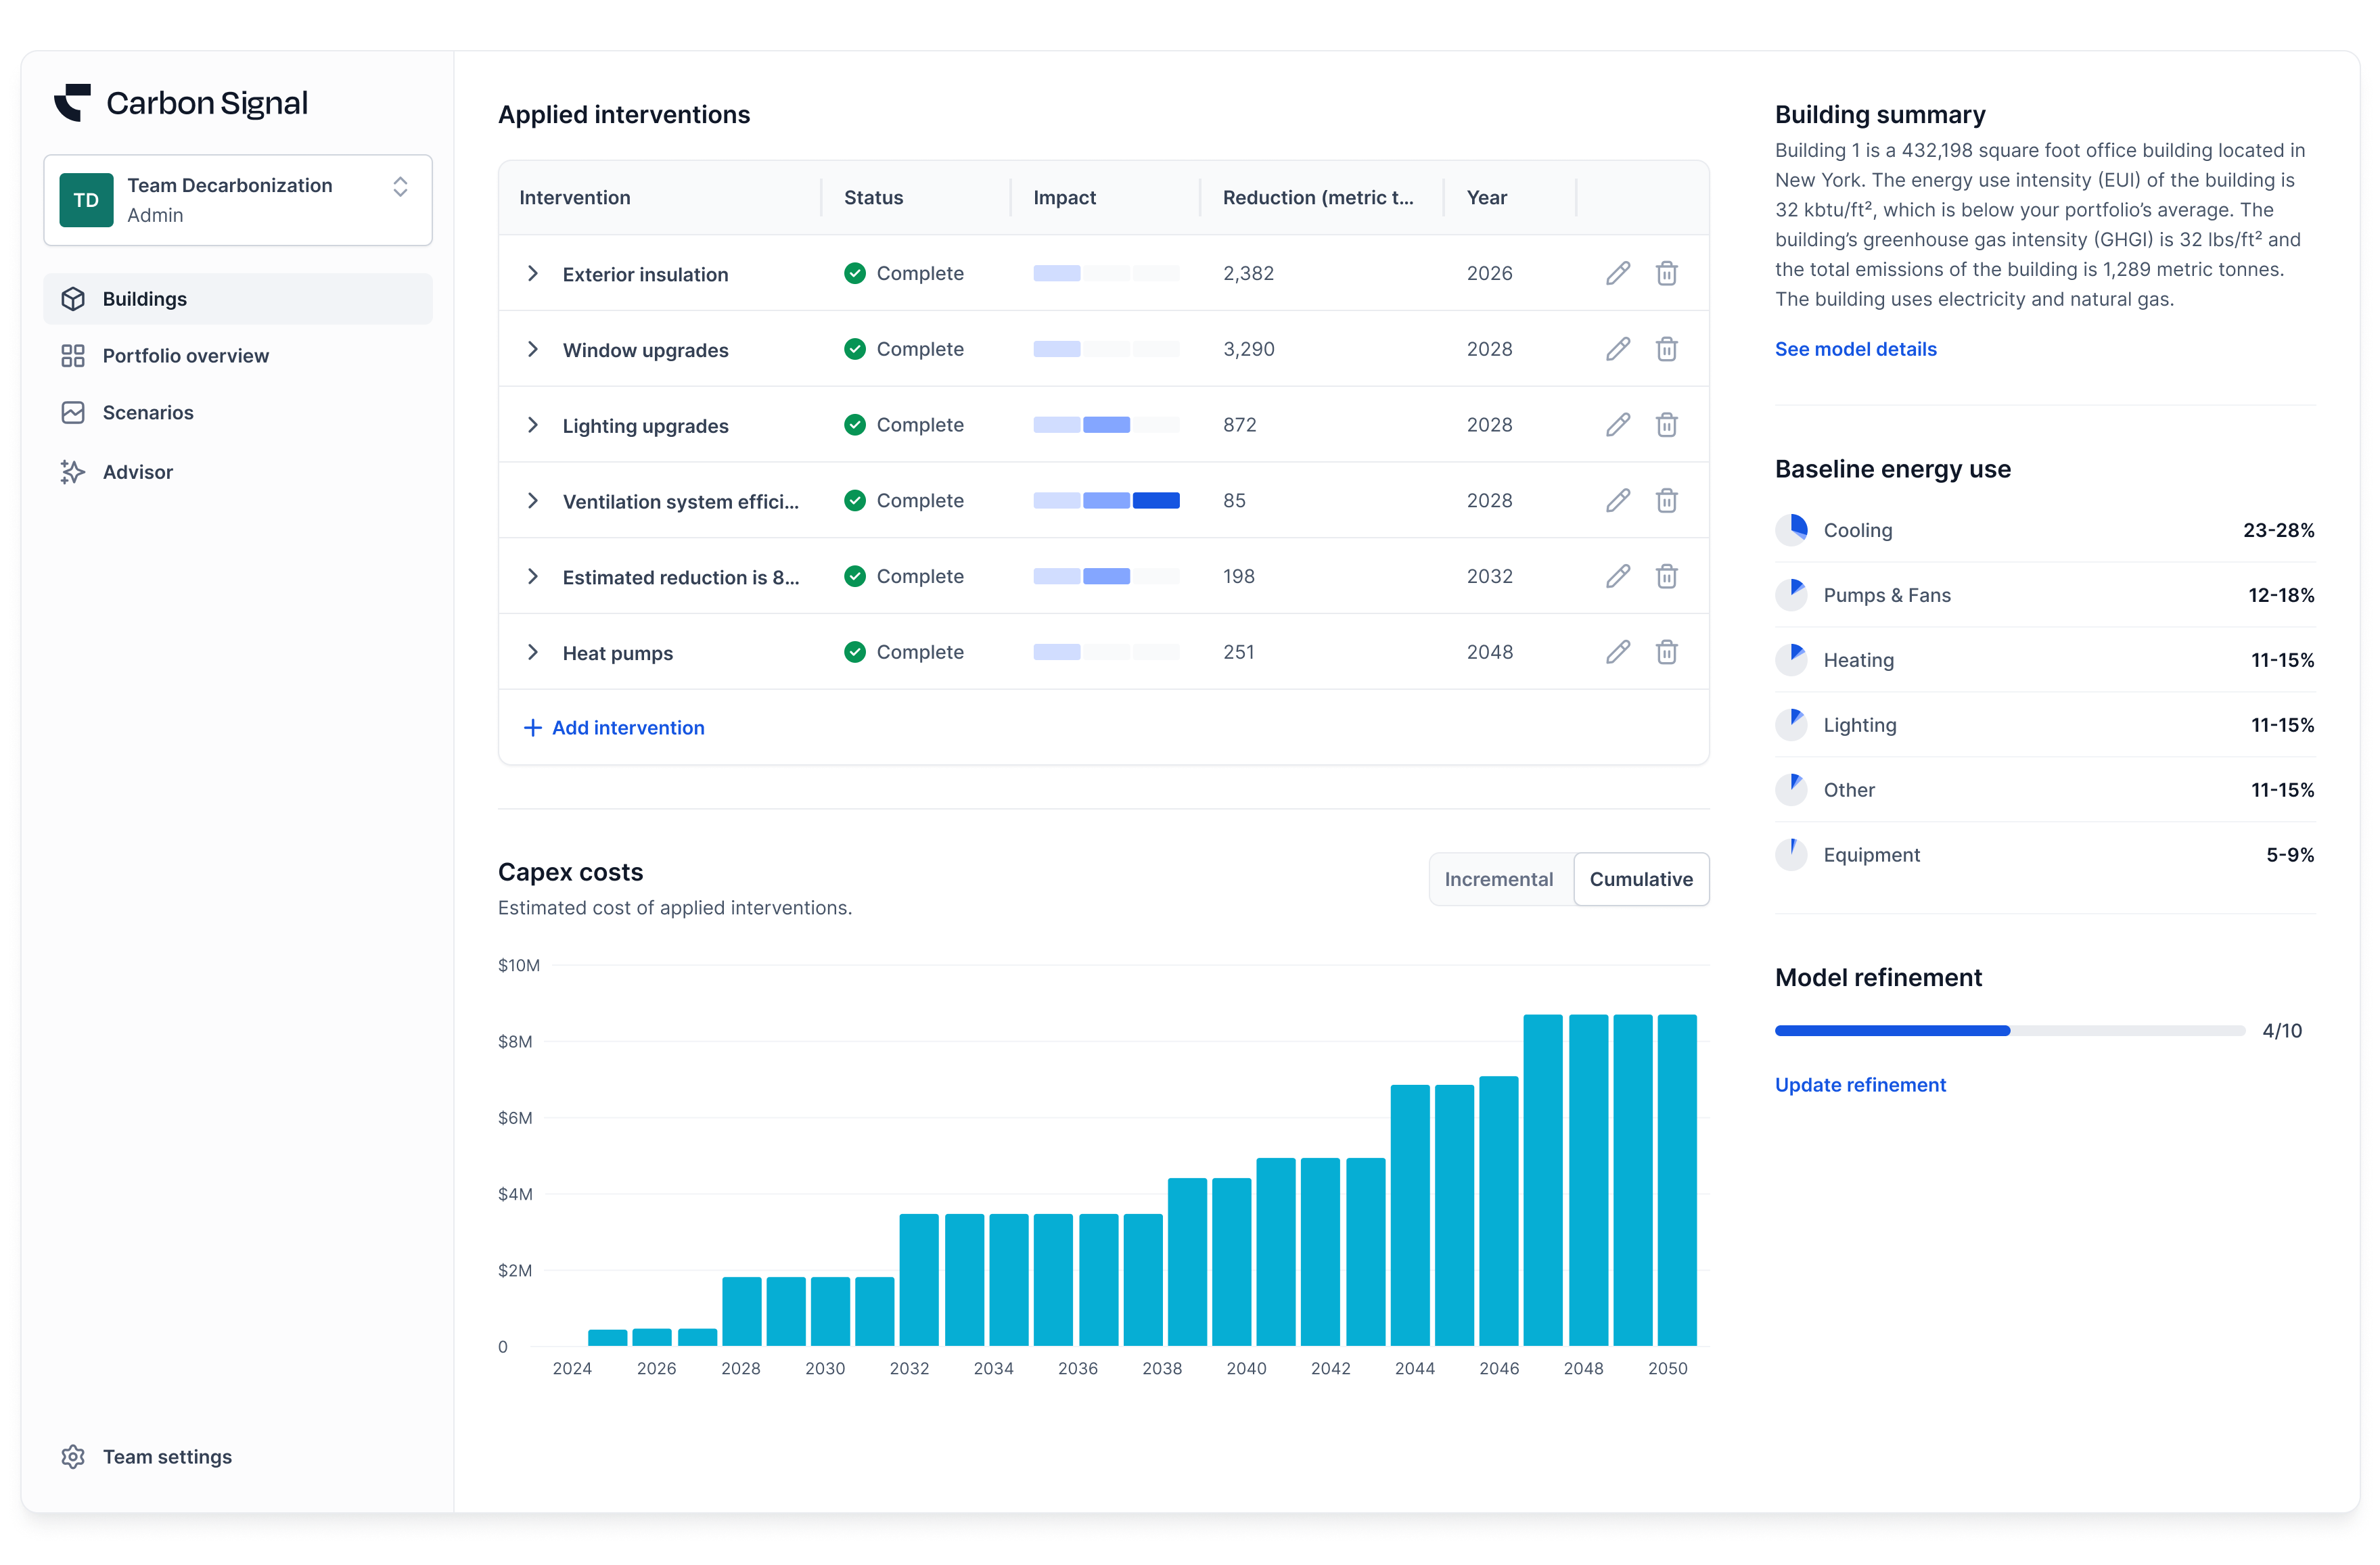
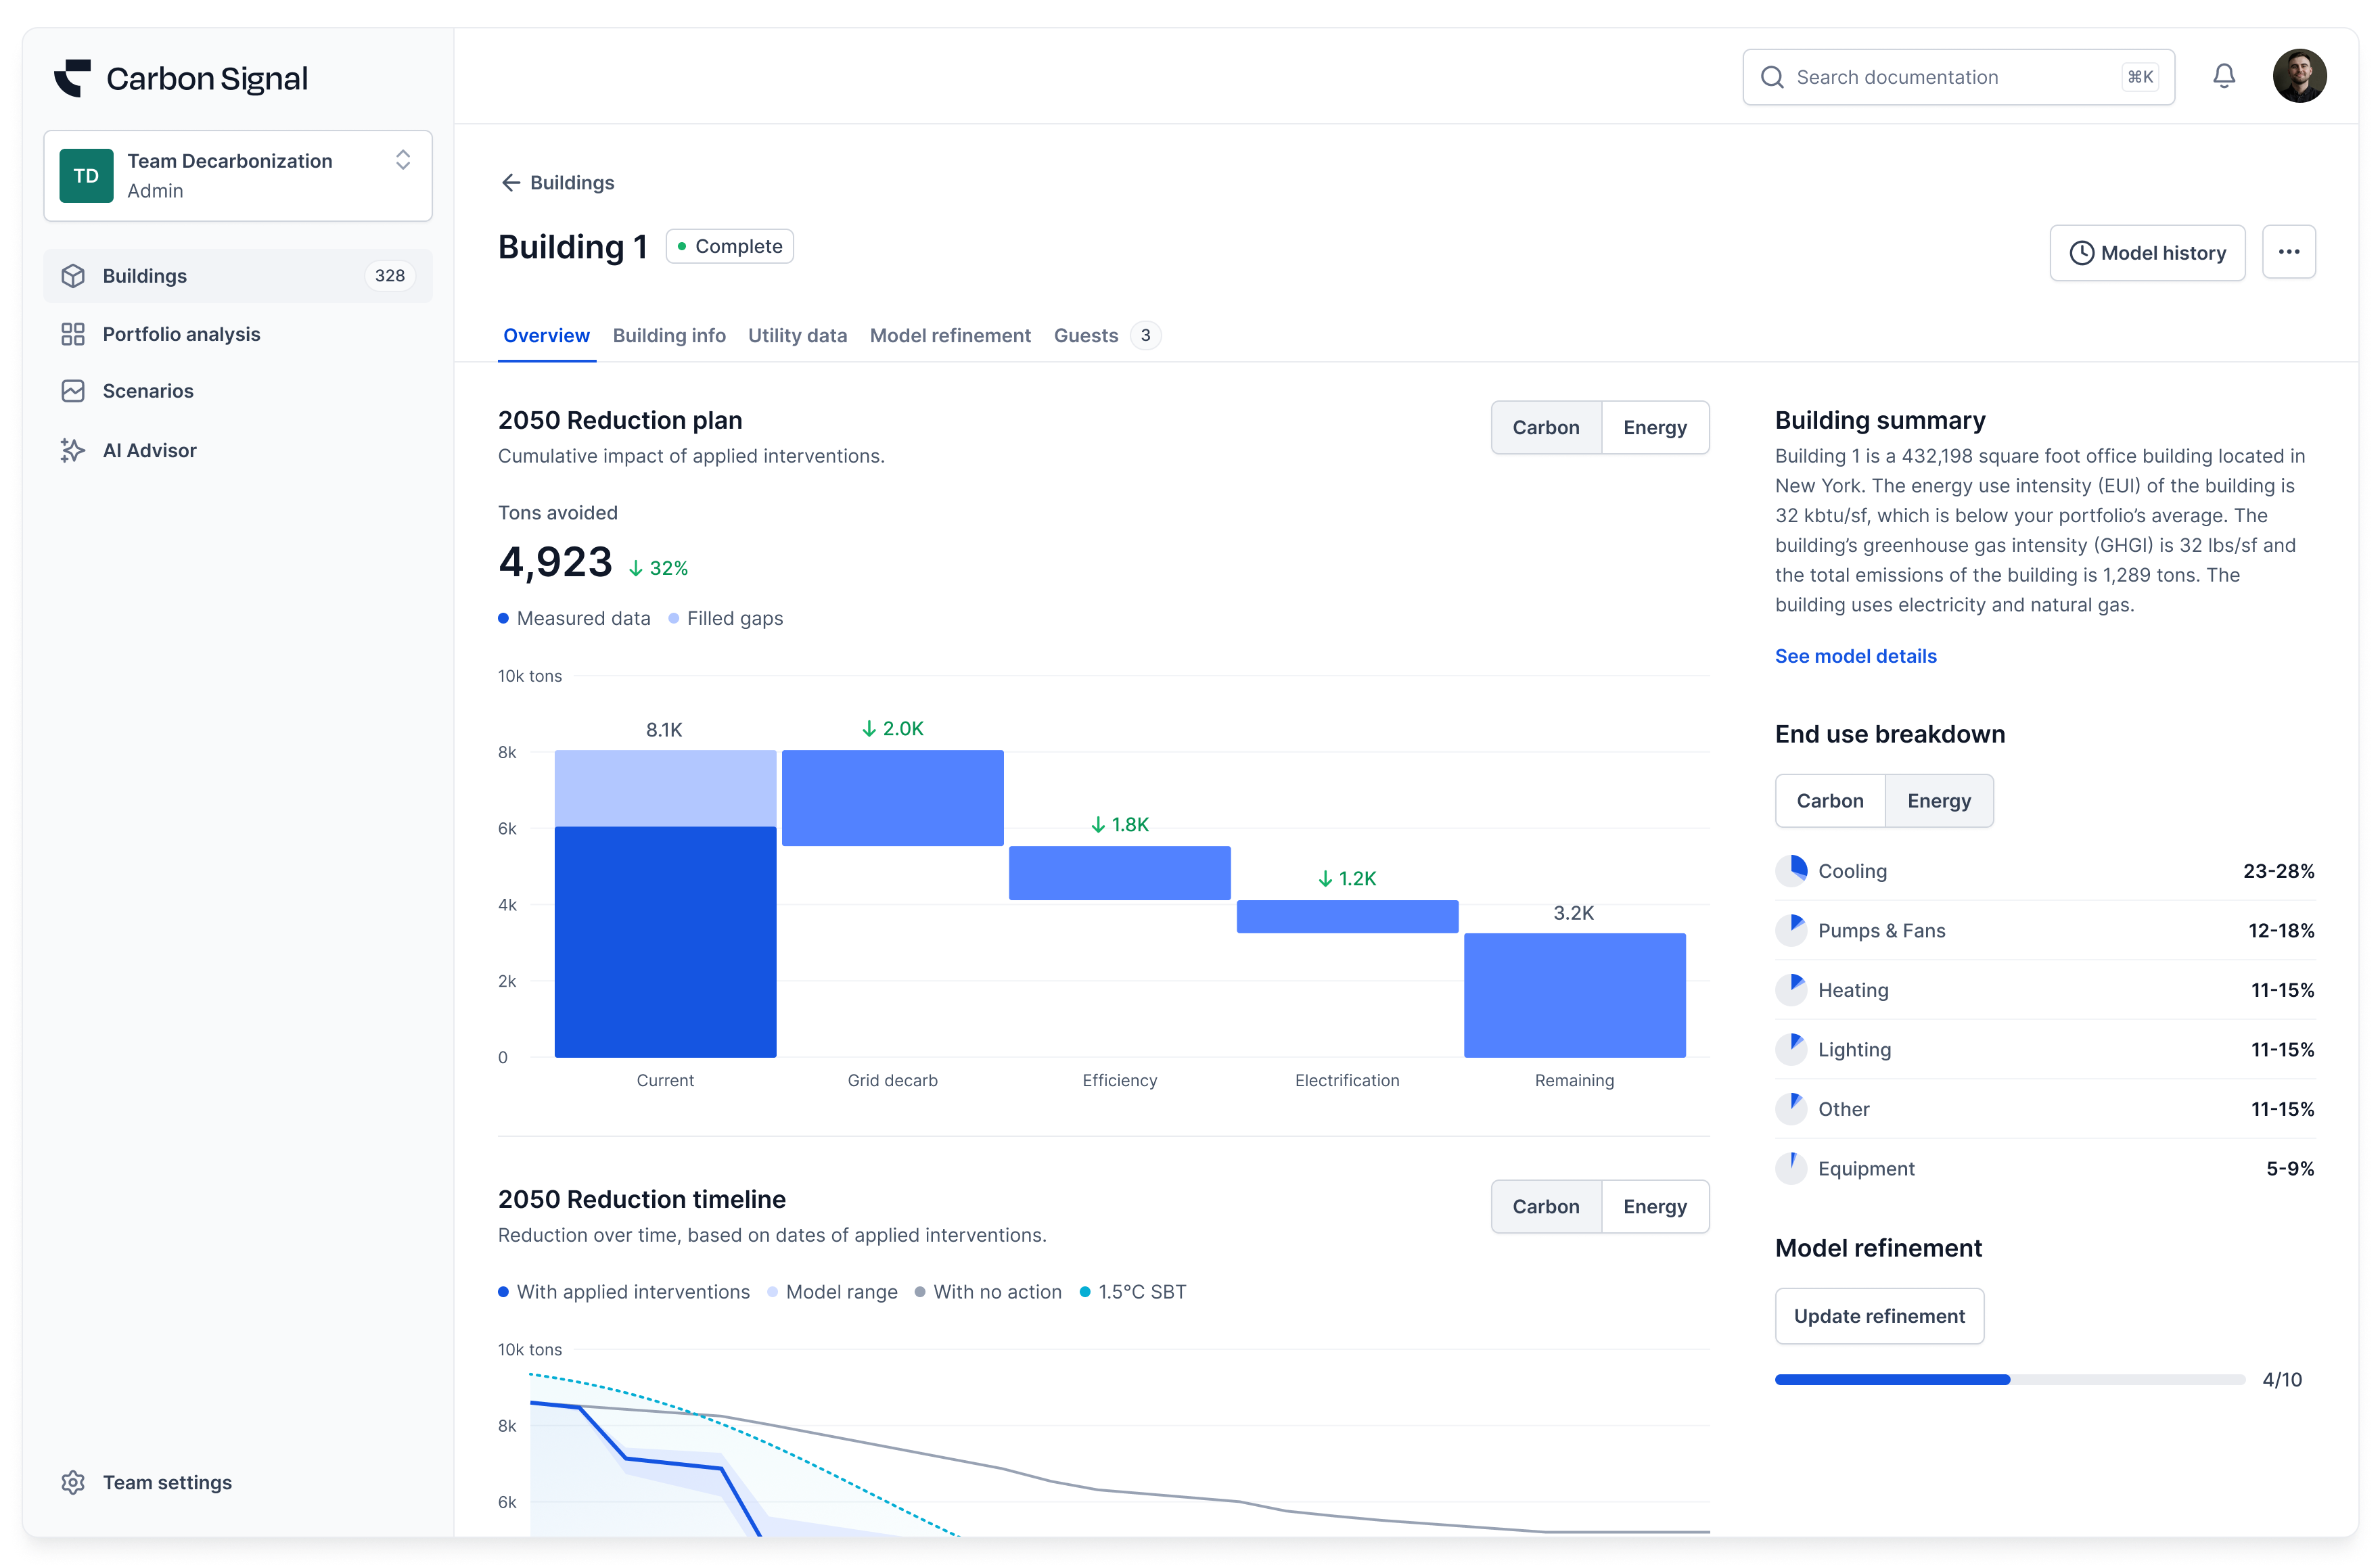
We’ve redesigned the Model Refinement experience with a new Energy Model workspace that brings the building’s characterization insights and model refinement controls together in a single view.
Previously, characterization results and refinement targets were separated across different views. Now, the characterization distribution for each building parameter is displayed directly alongside refinement targets, making it easier to compare model assumptions against the current calibrated model ensemble.
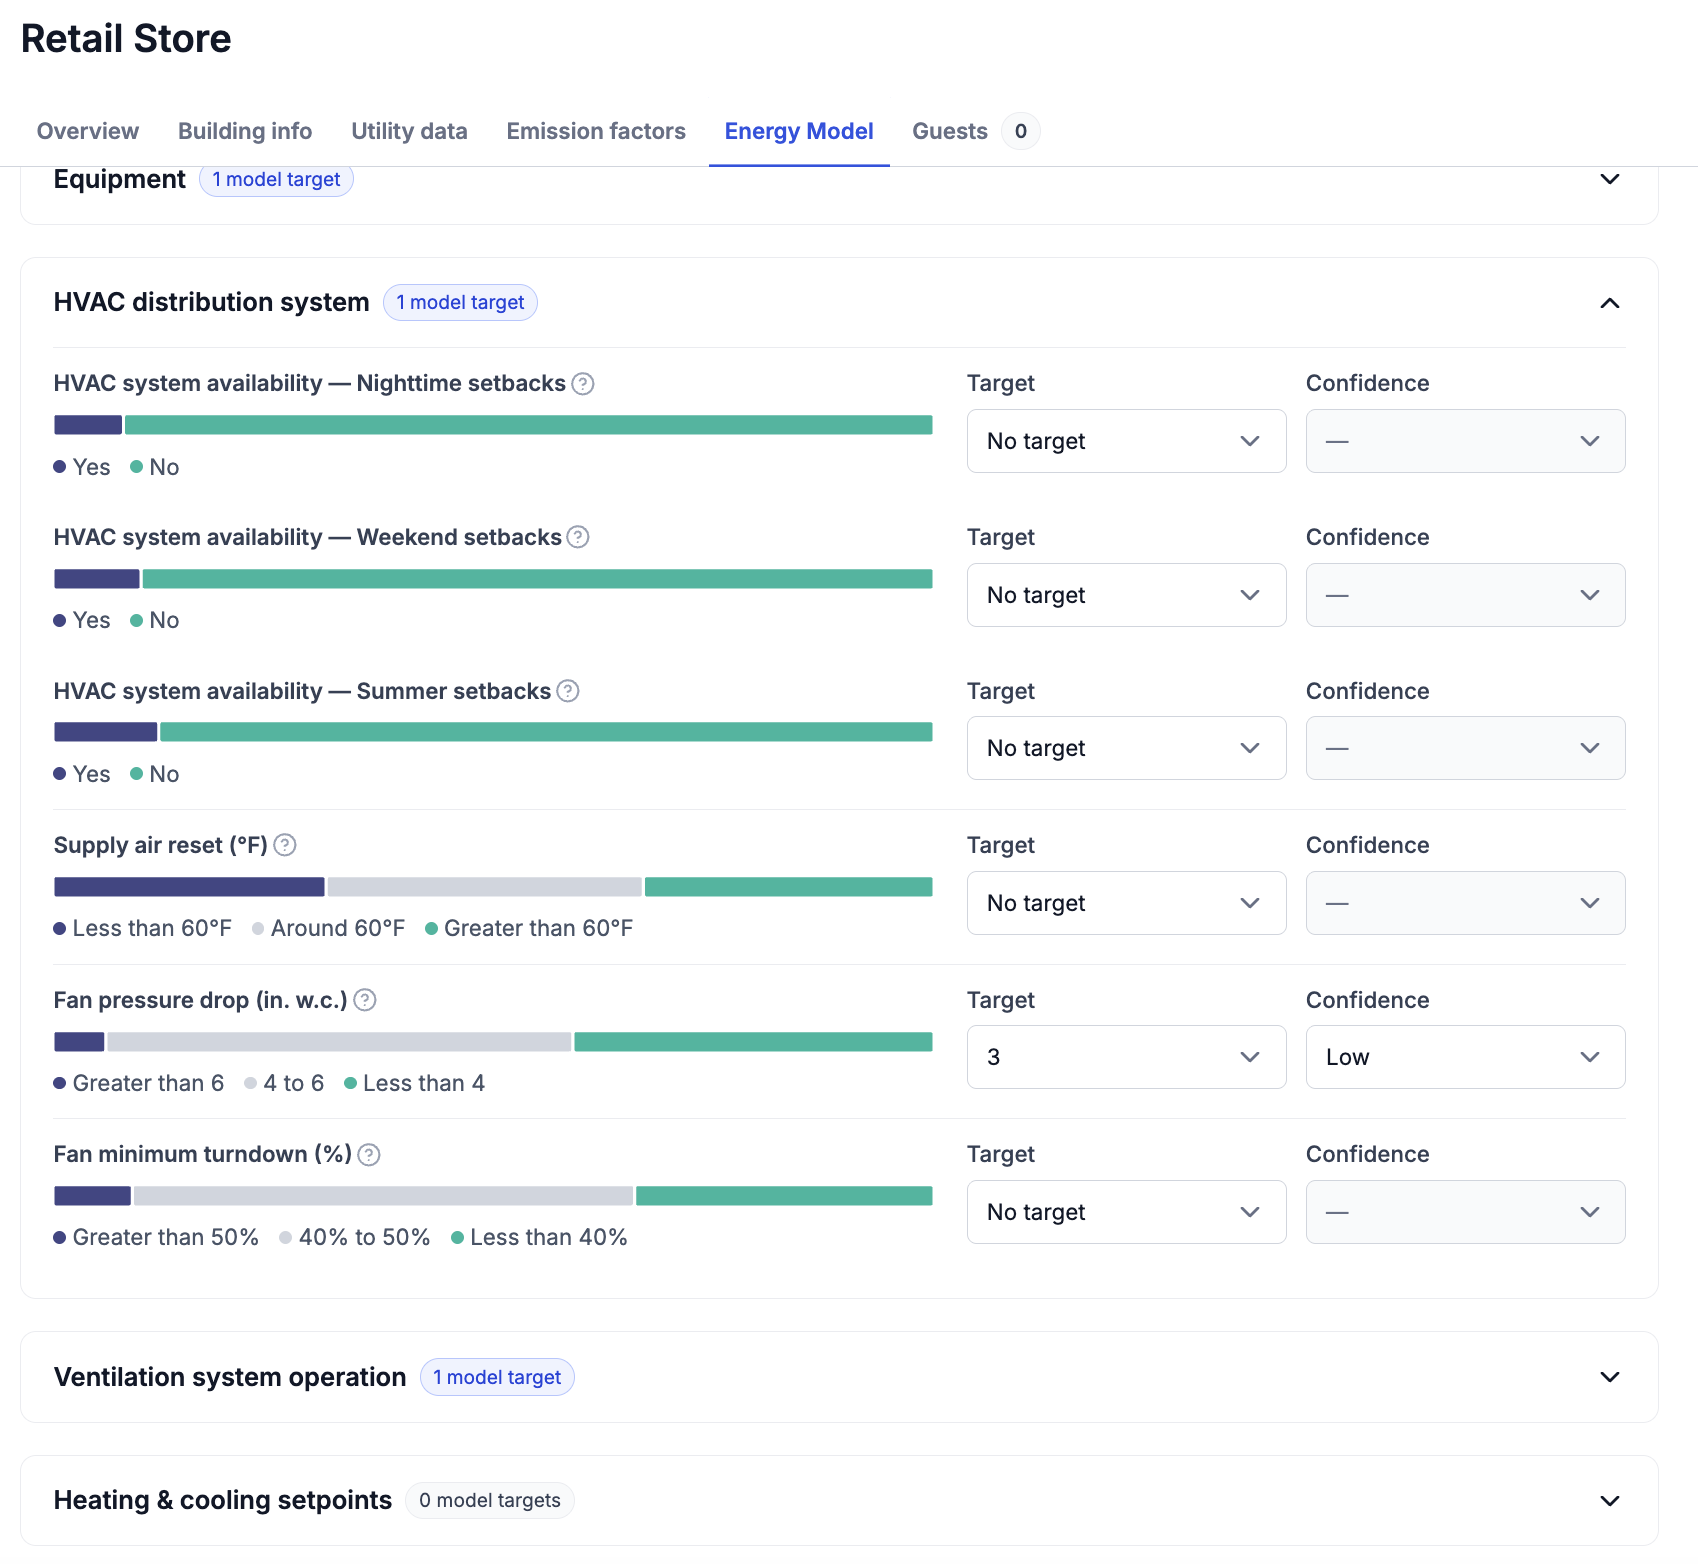
With this update, you can review characterization distribution results and model targets side-by-side, allowing you to iterate on key baseline model characteristics without switching between screens.