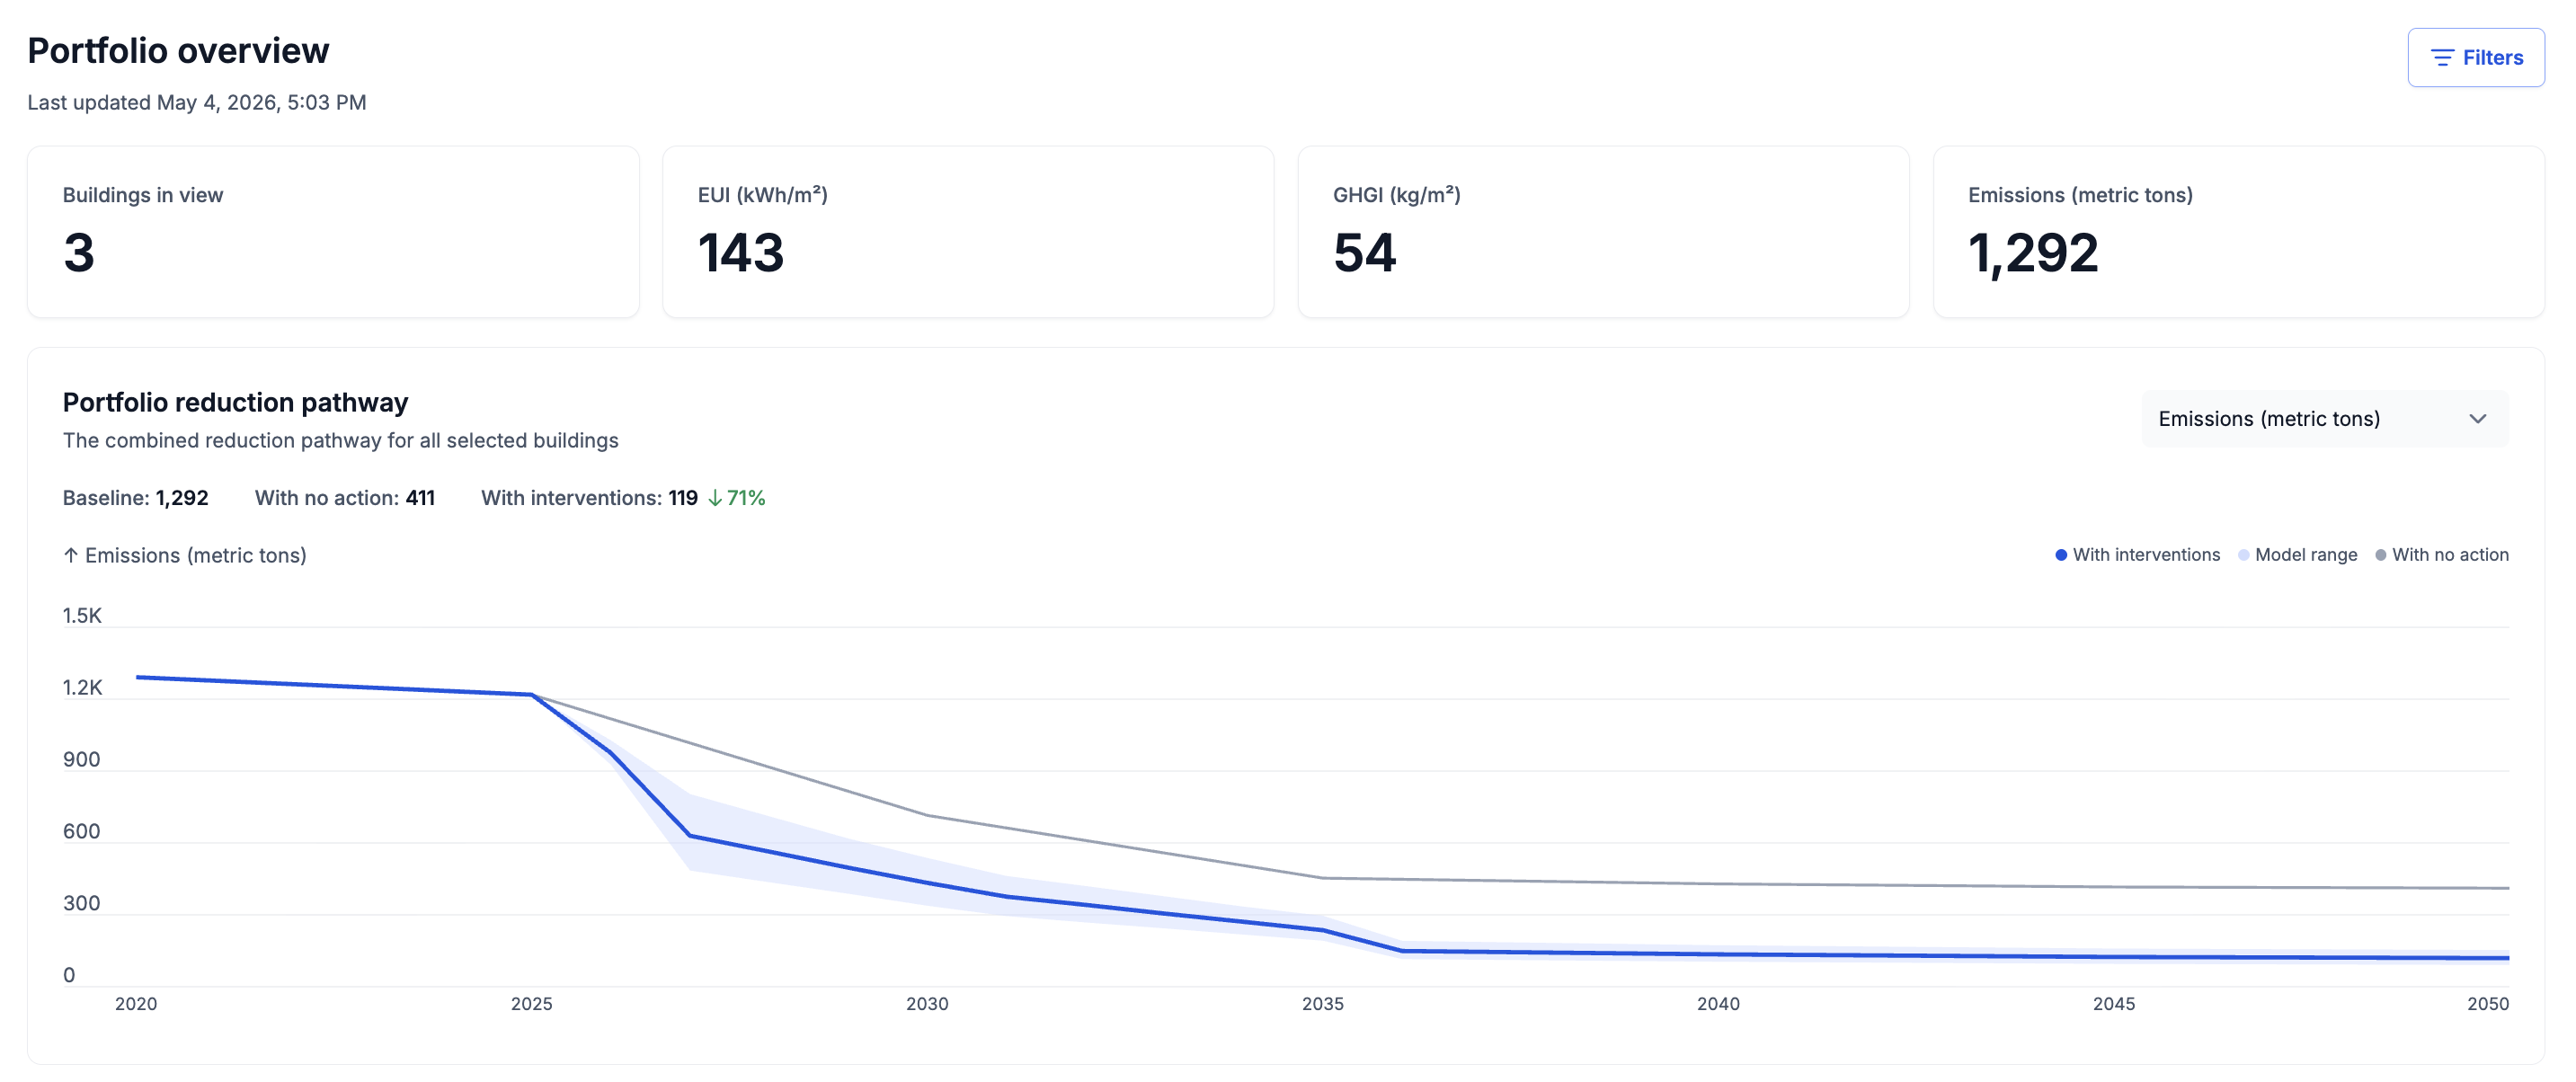
We’ve enhanced Carbon Signal to better support international portfolios and increasingly complex regulatory requirements.
This release introduces International SI units throughout key modeling workflows and expands Building Performance Standards (BPS) to support Source Energy targets and mixed-use buildings with multiple occupancy types. Together, these updates make it easier to model buildings using local units and evaluate compliance more accurately across a wider range of jurisdictions.
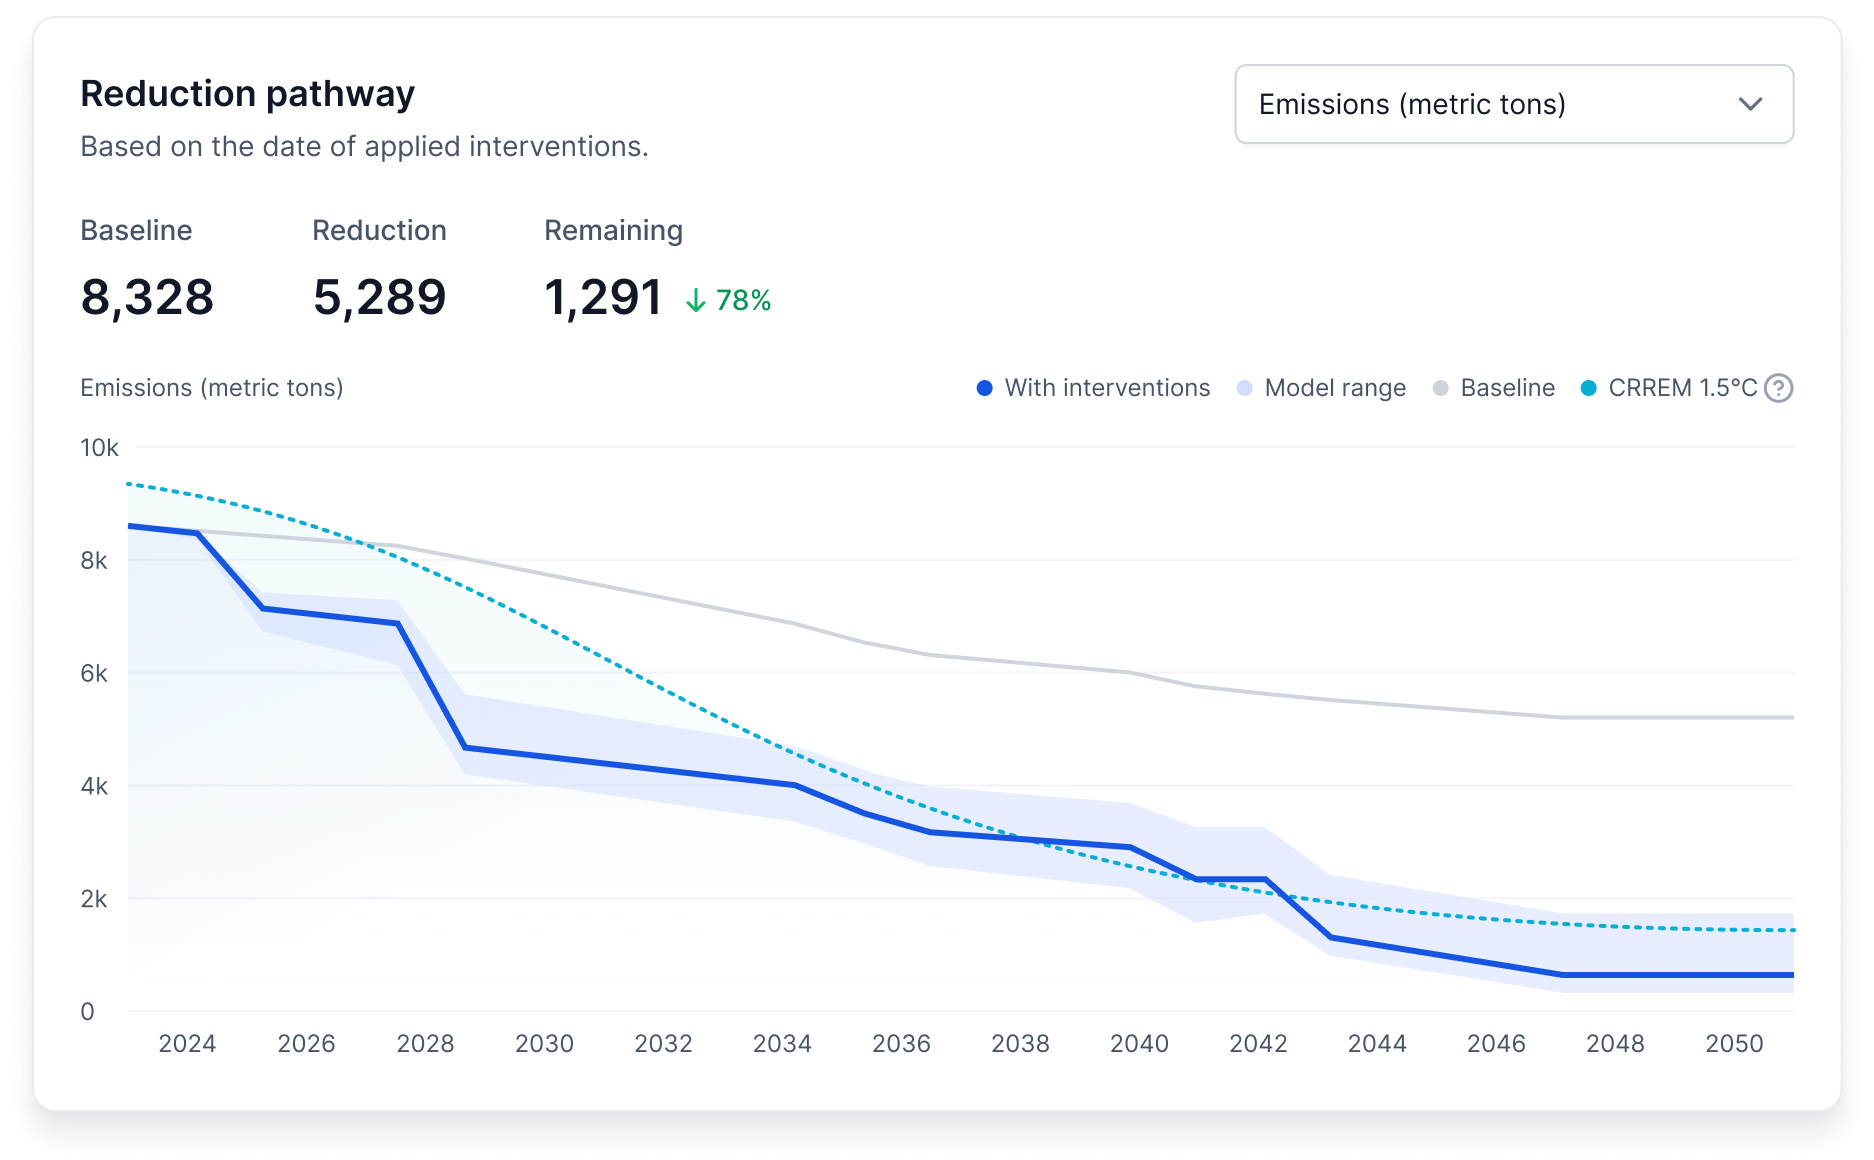
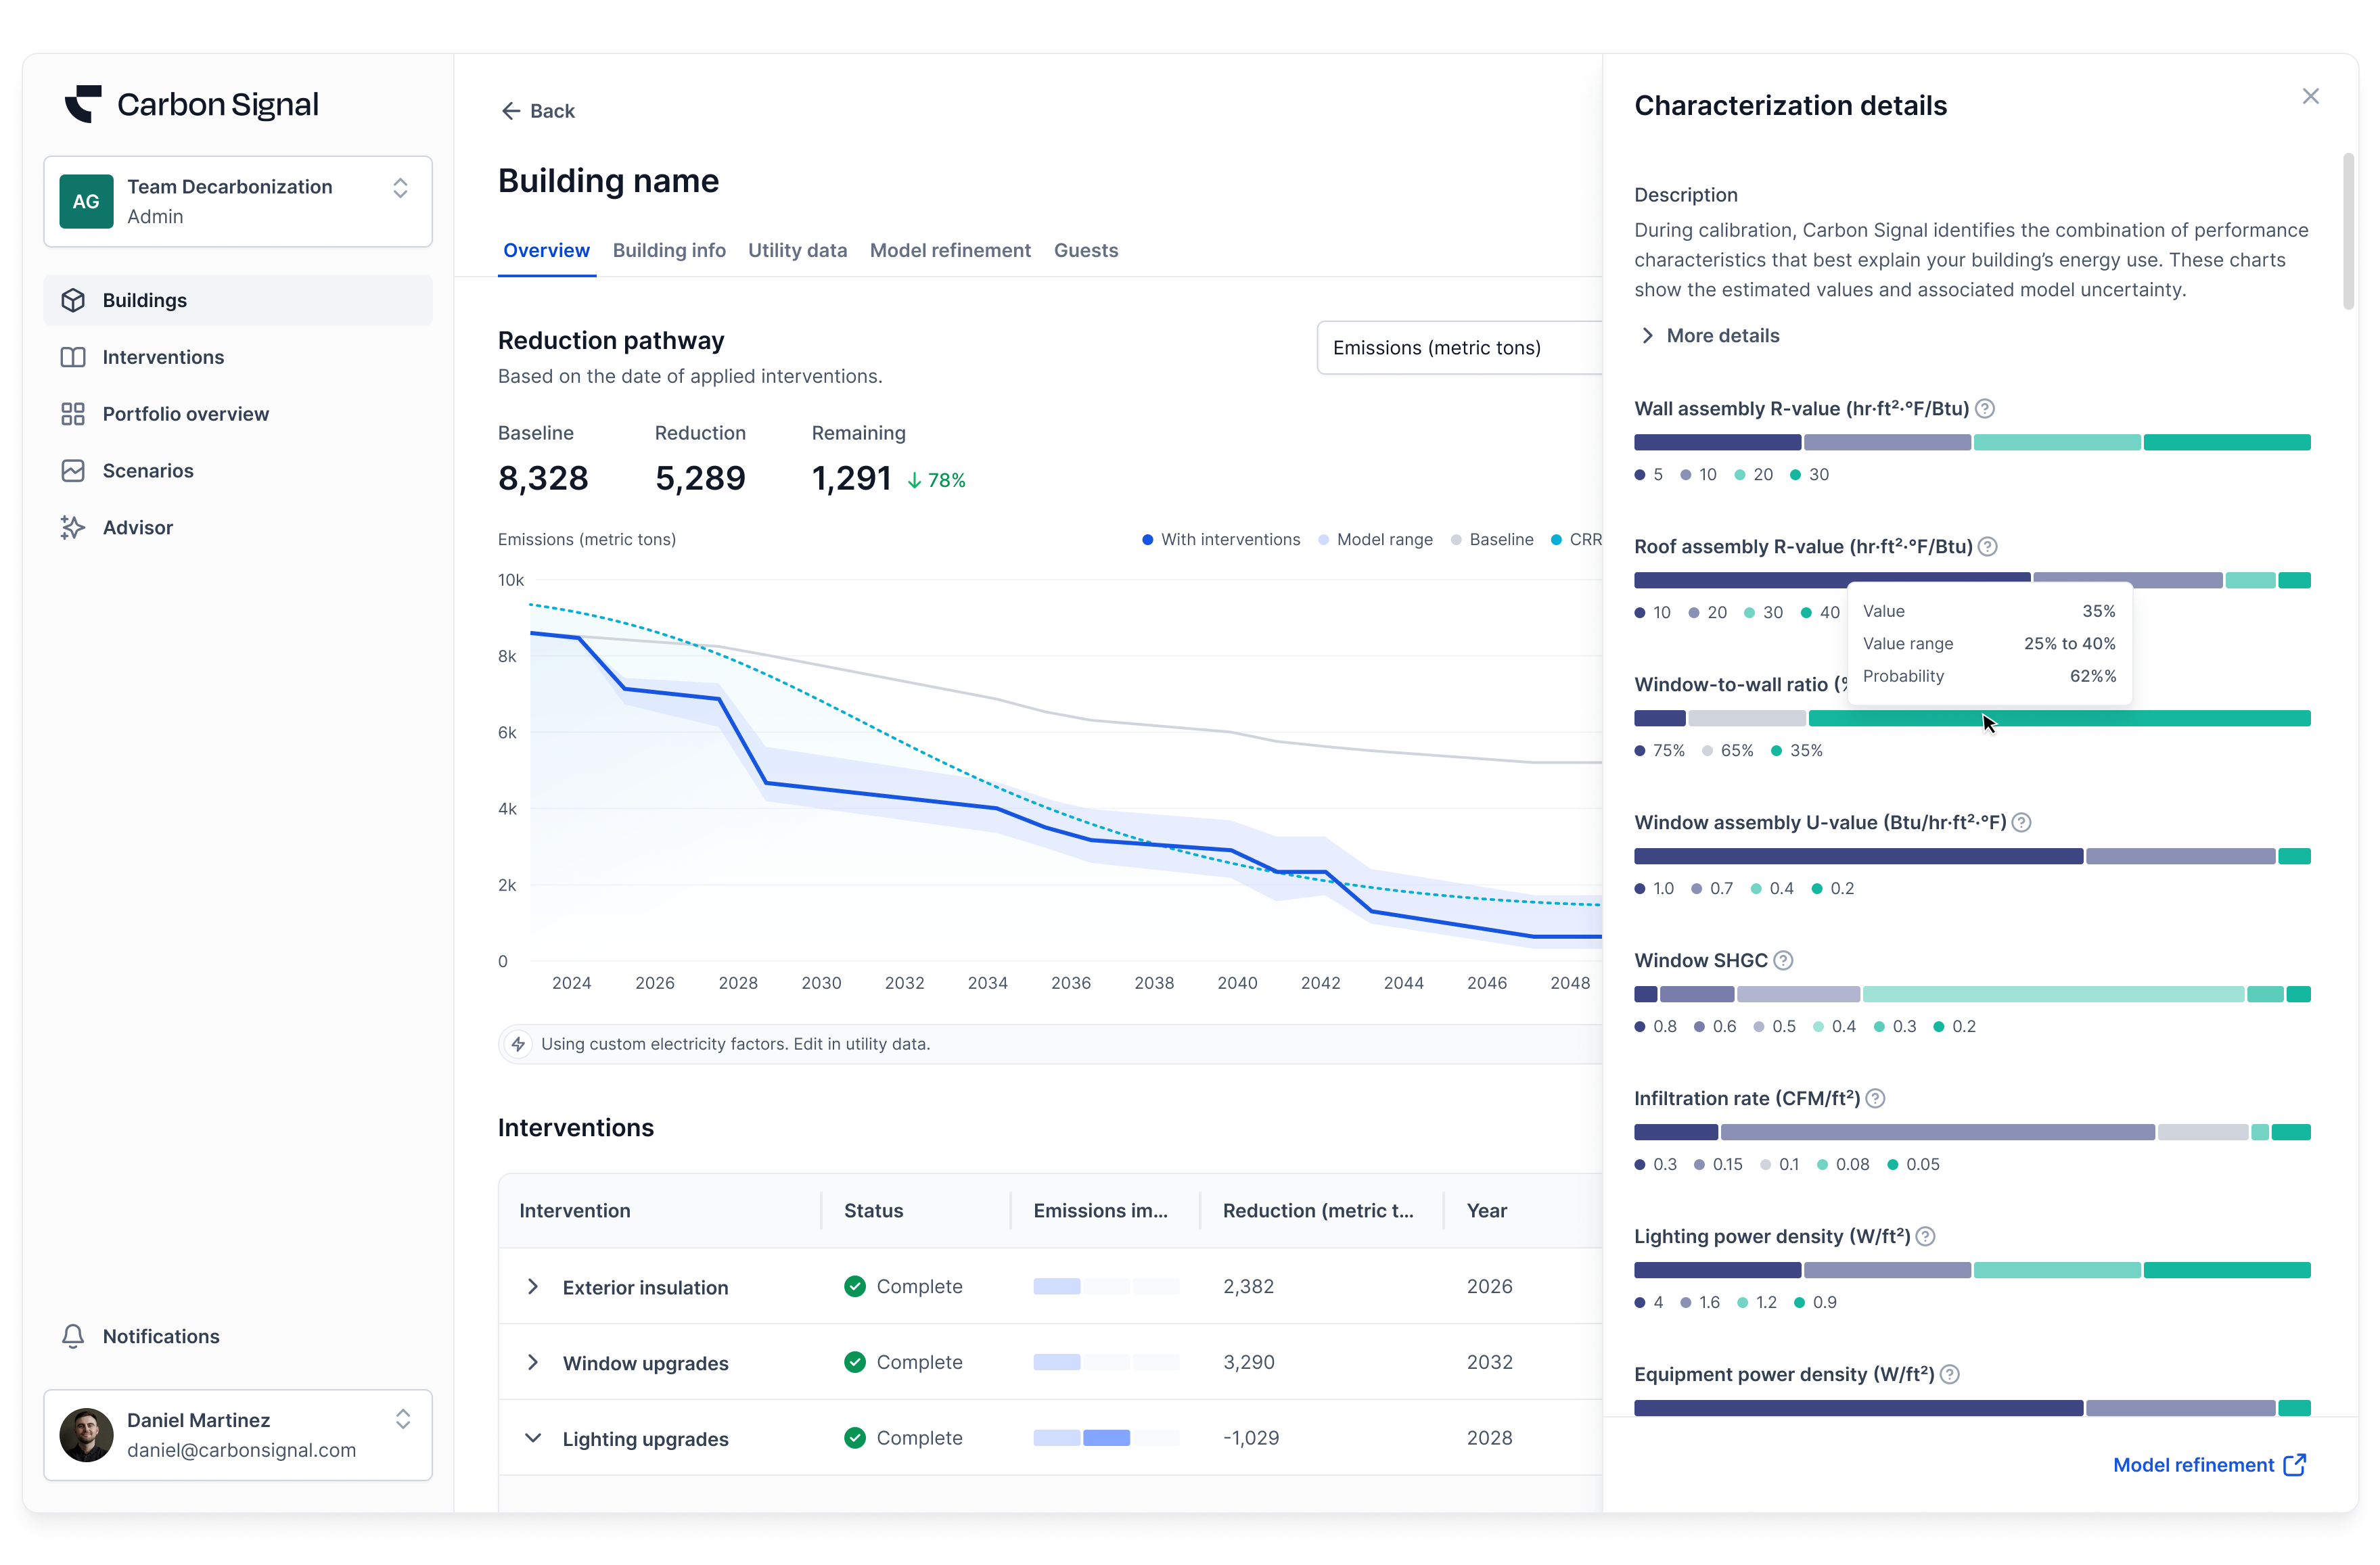
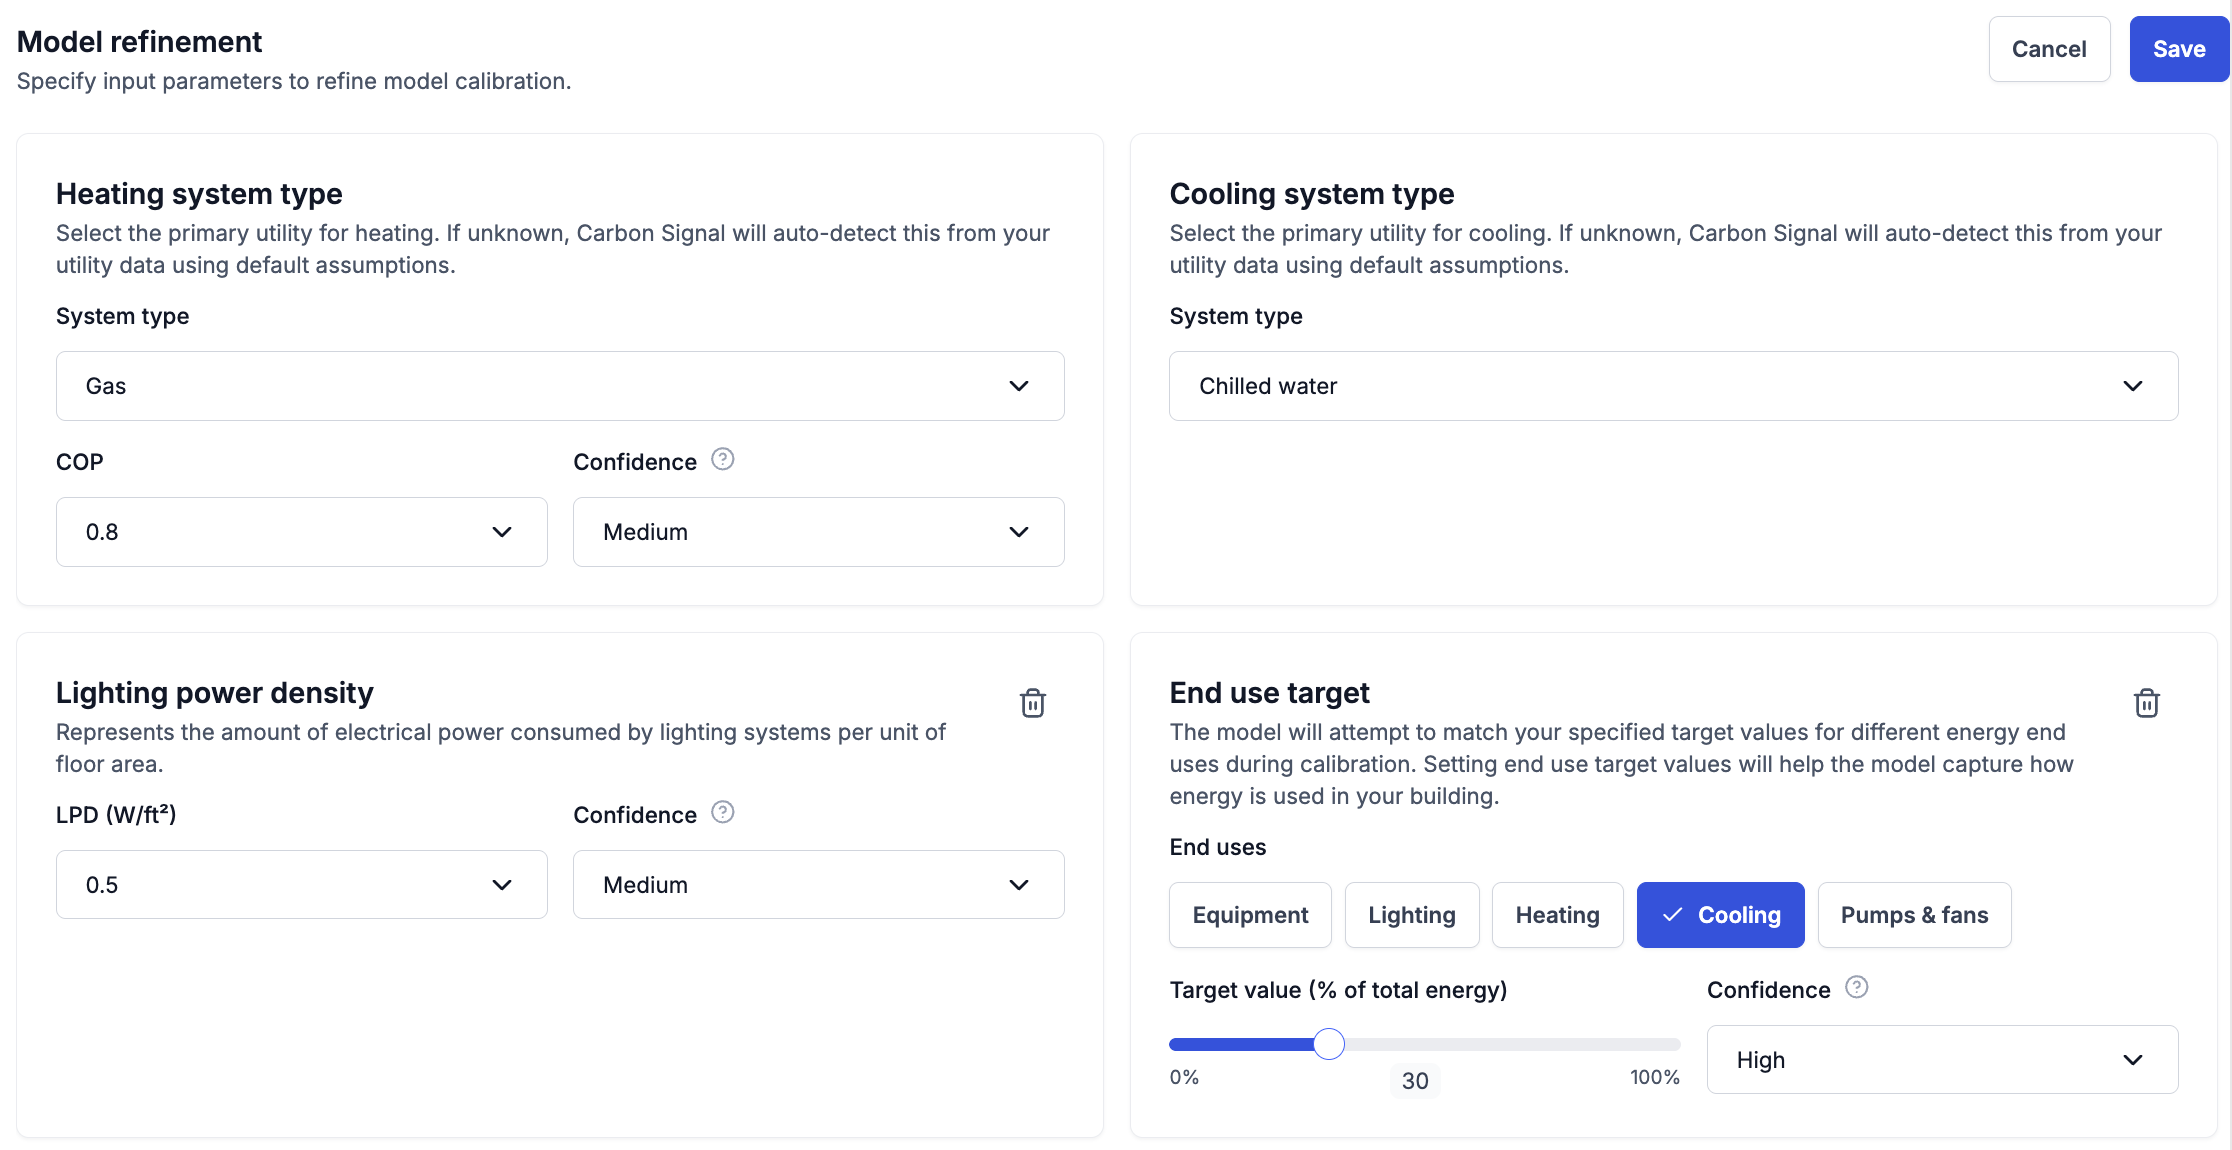
International SI Units for Characterization and Model Refinement
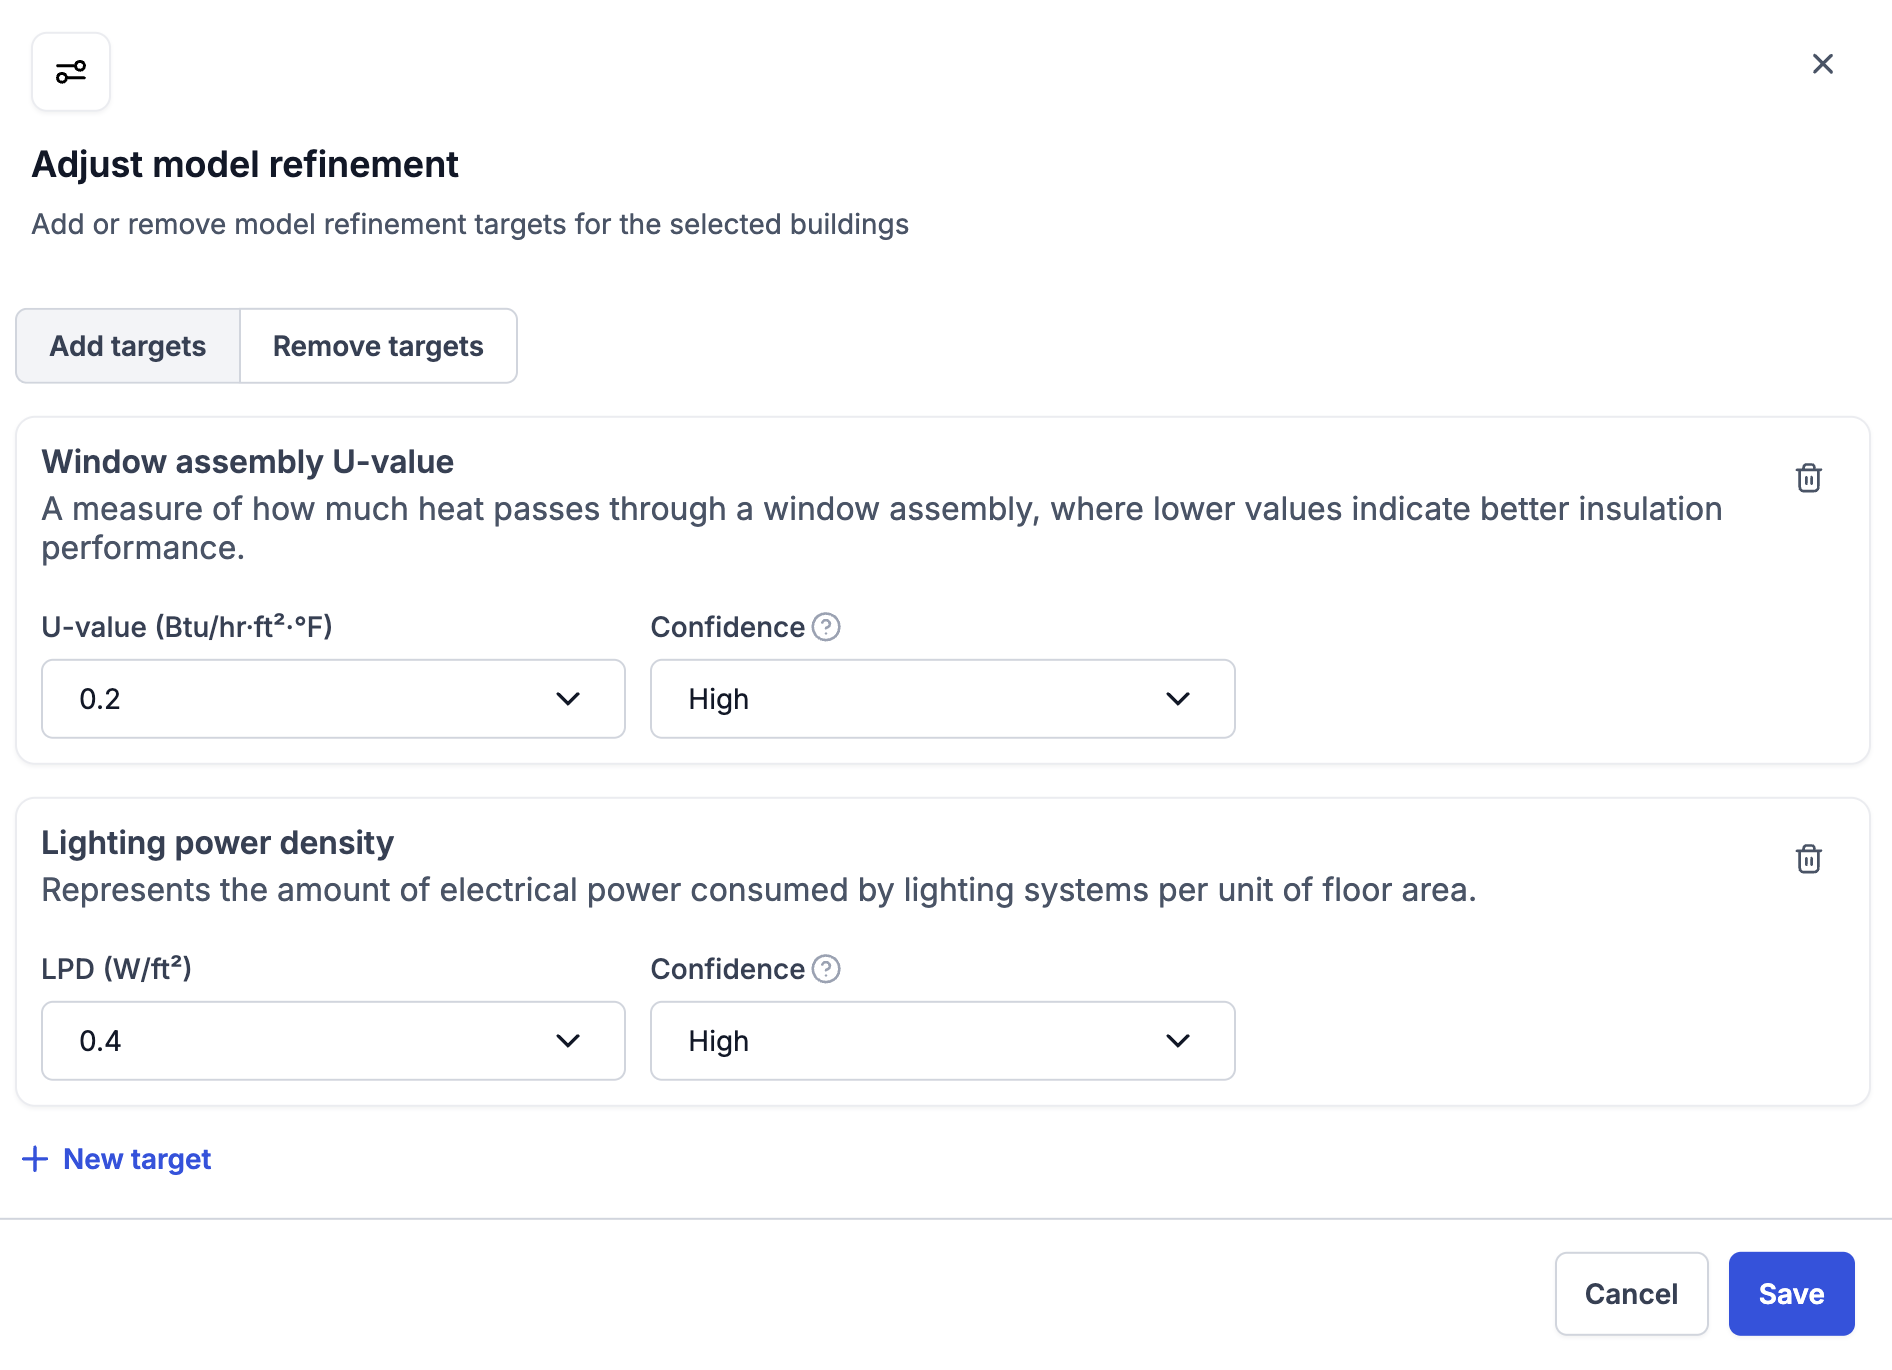
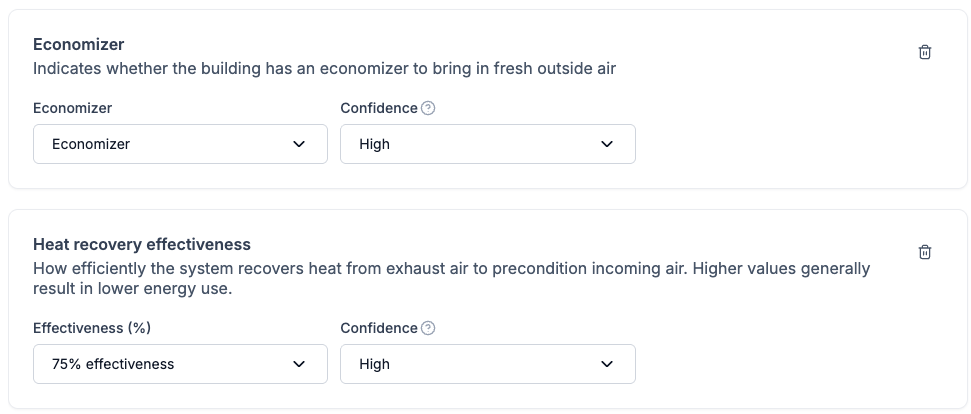
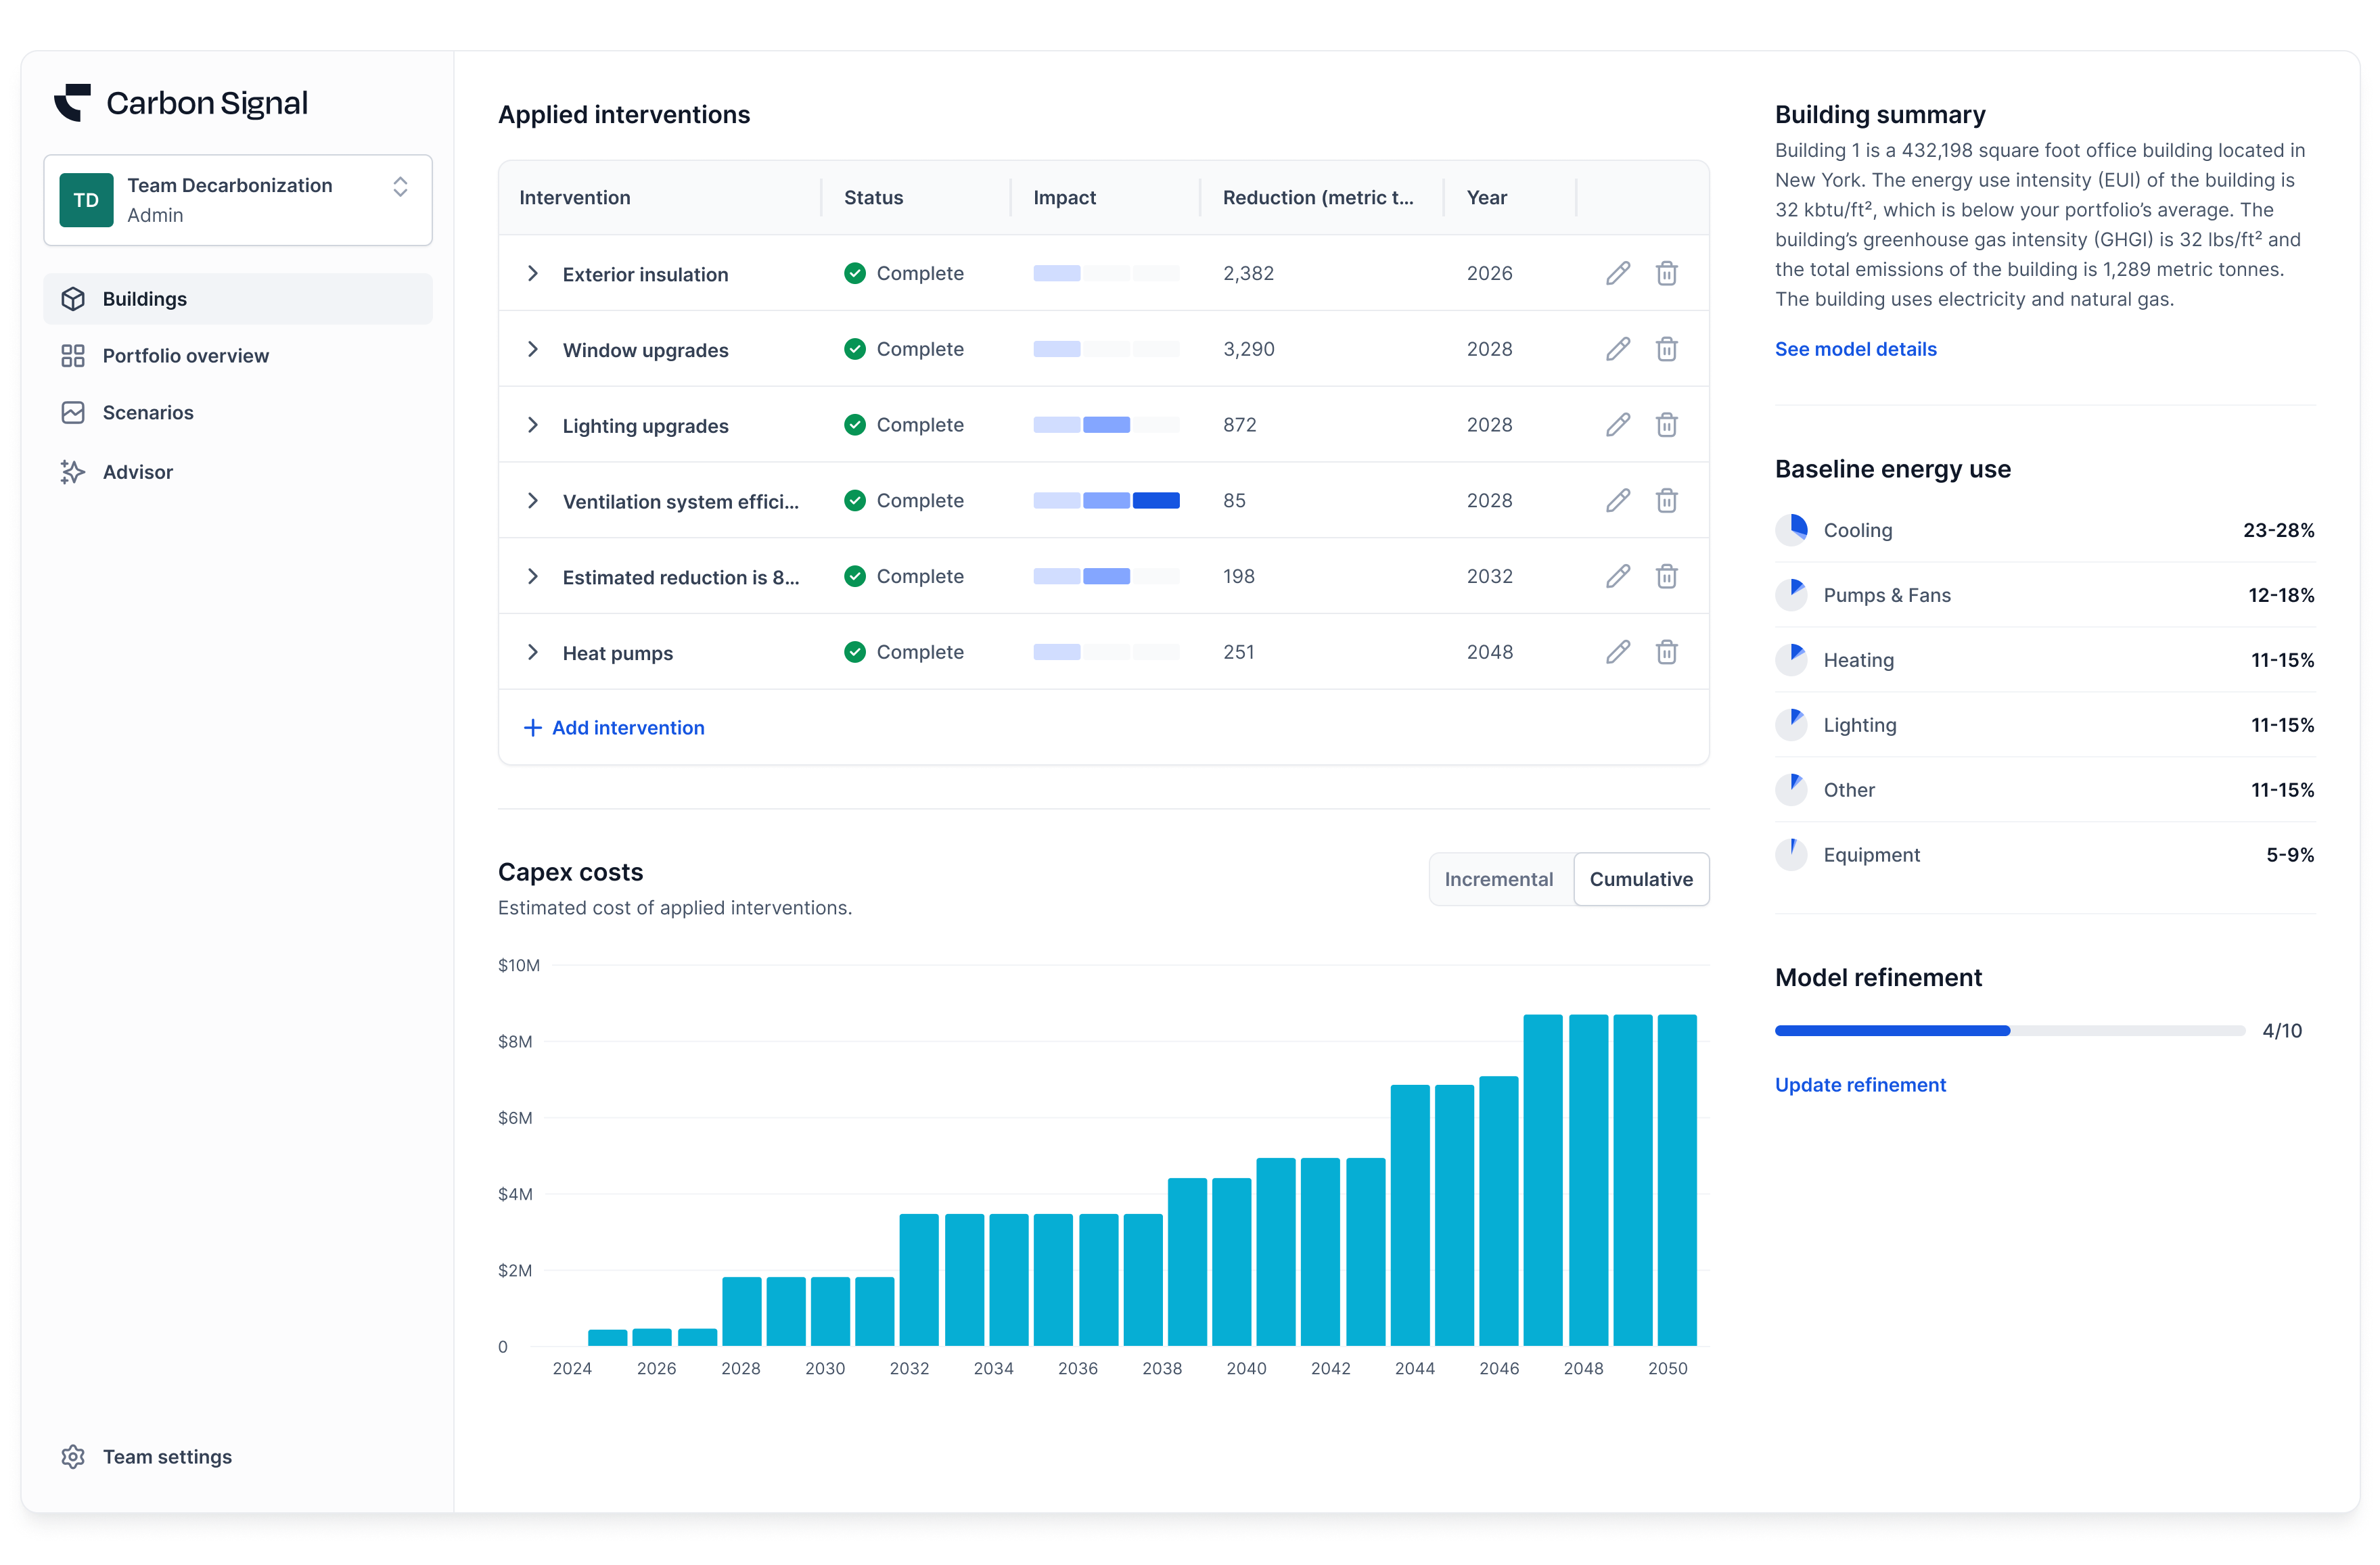
Carbon Signal now supports international SI units when reviewing Characterization details and configuring Model Refinement parameters.
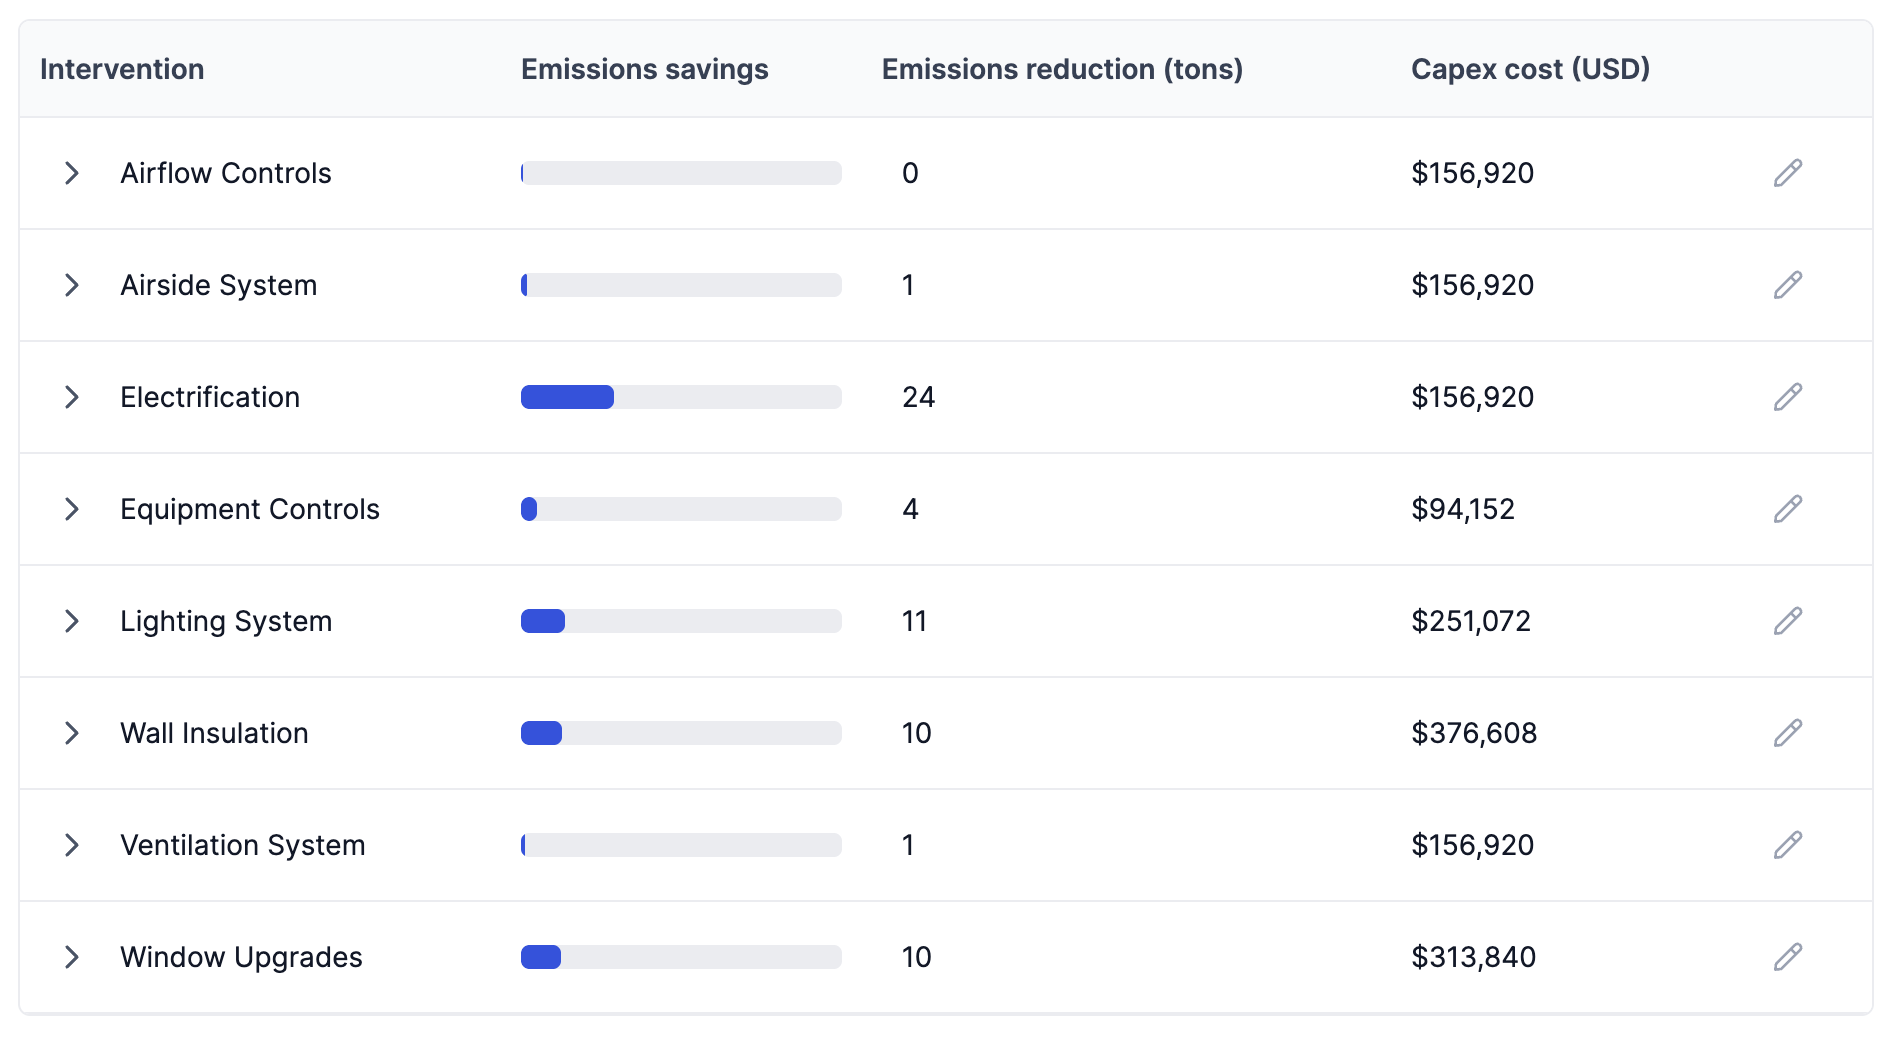
After switching to international SI units, users can view and edit building characteristics using metric measurements such as:
- W/m² for lighting and equipment power density
- W/m²·K for the U value of wall thermal performance
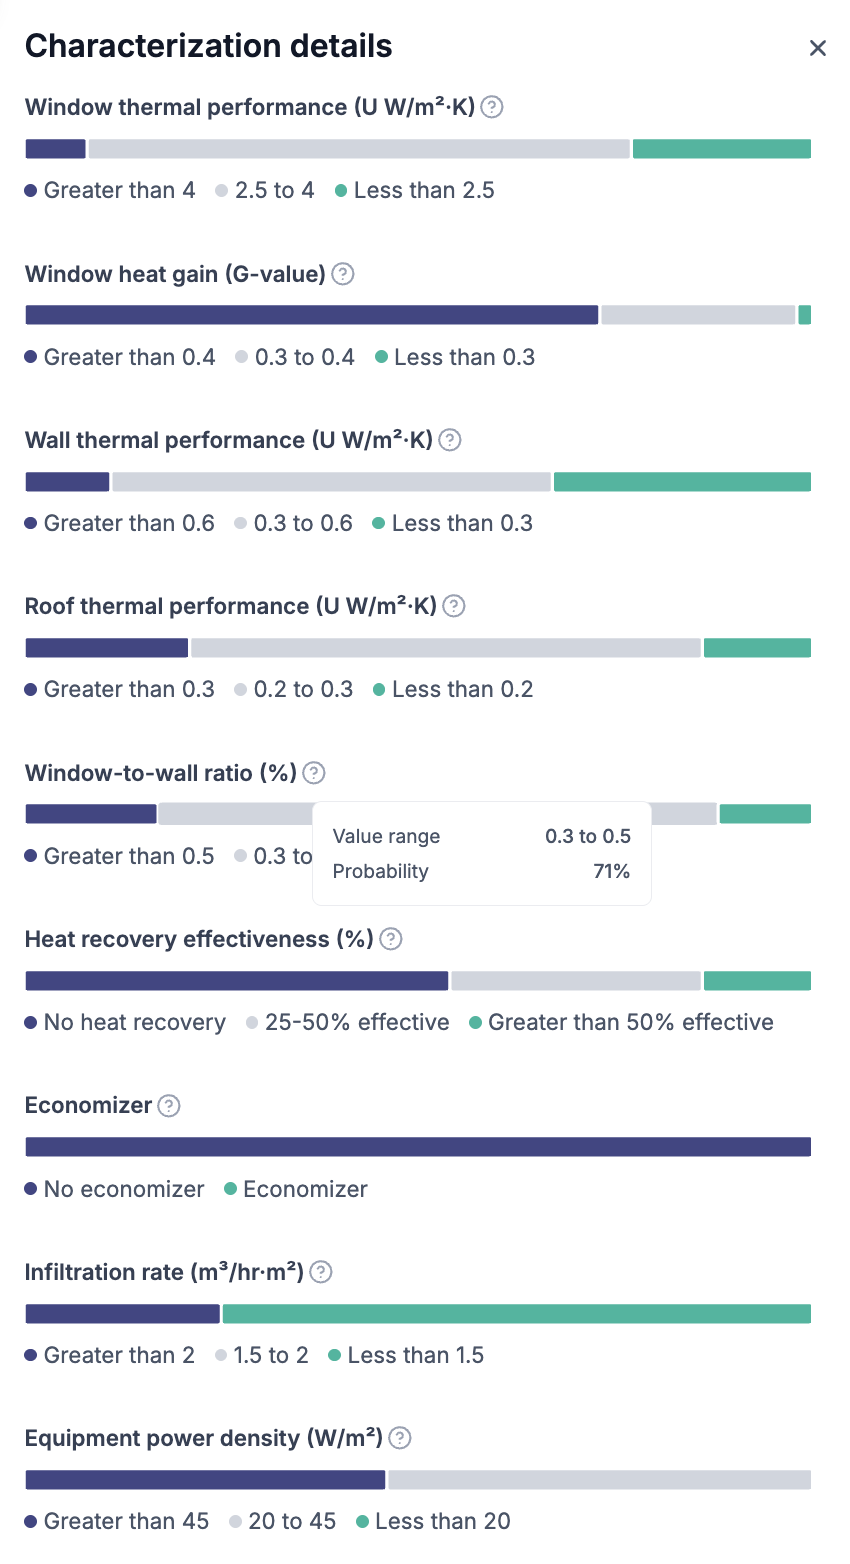
This update makes it easier for users working outside the US to interpret model outputs and refine assumptions using familiar units.
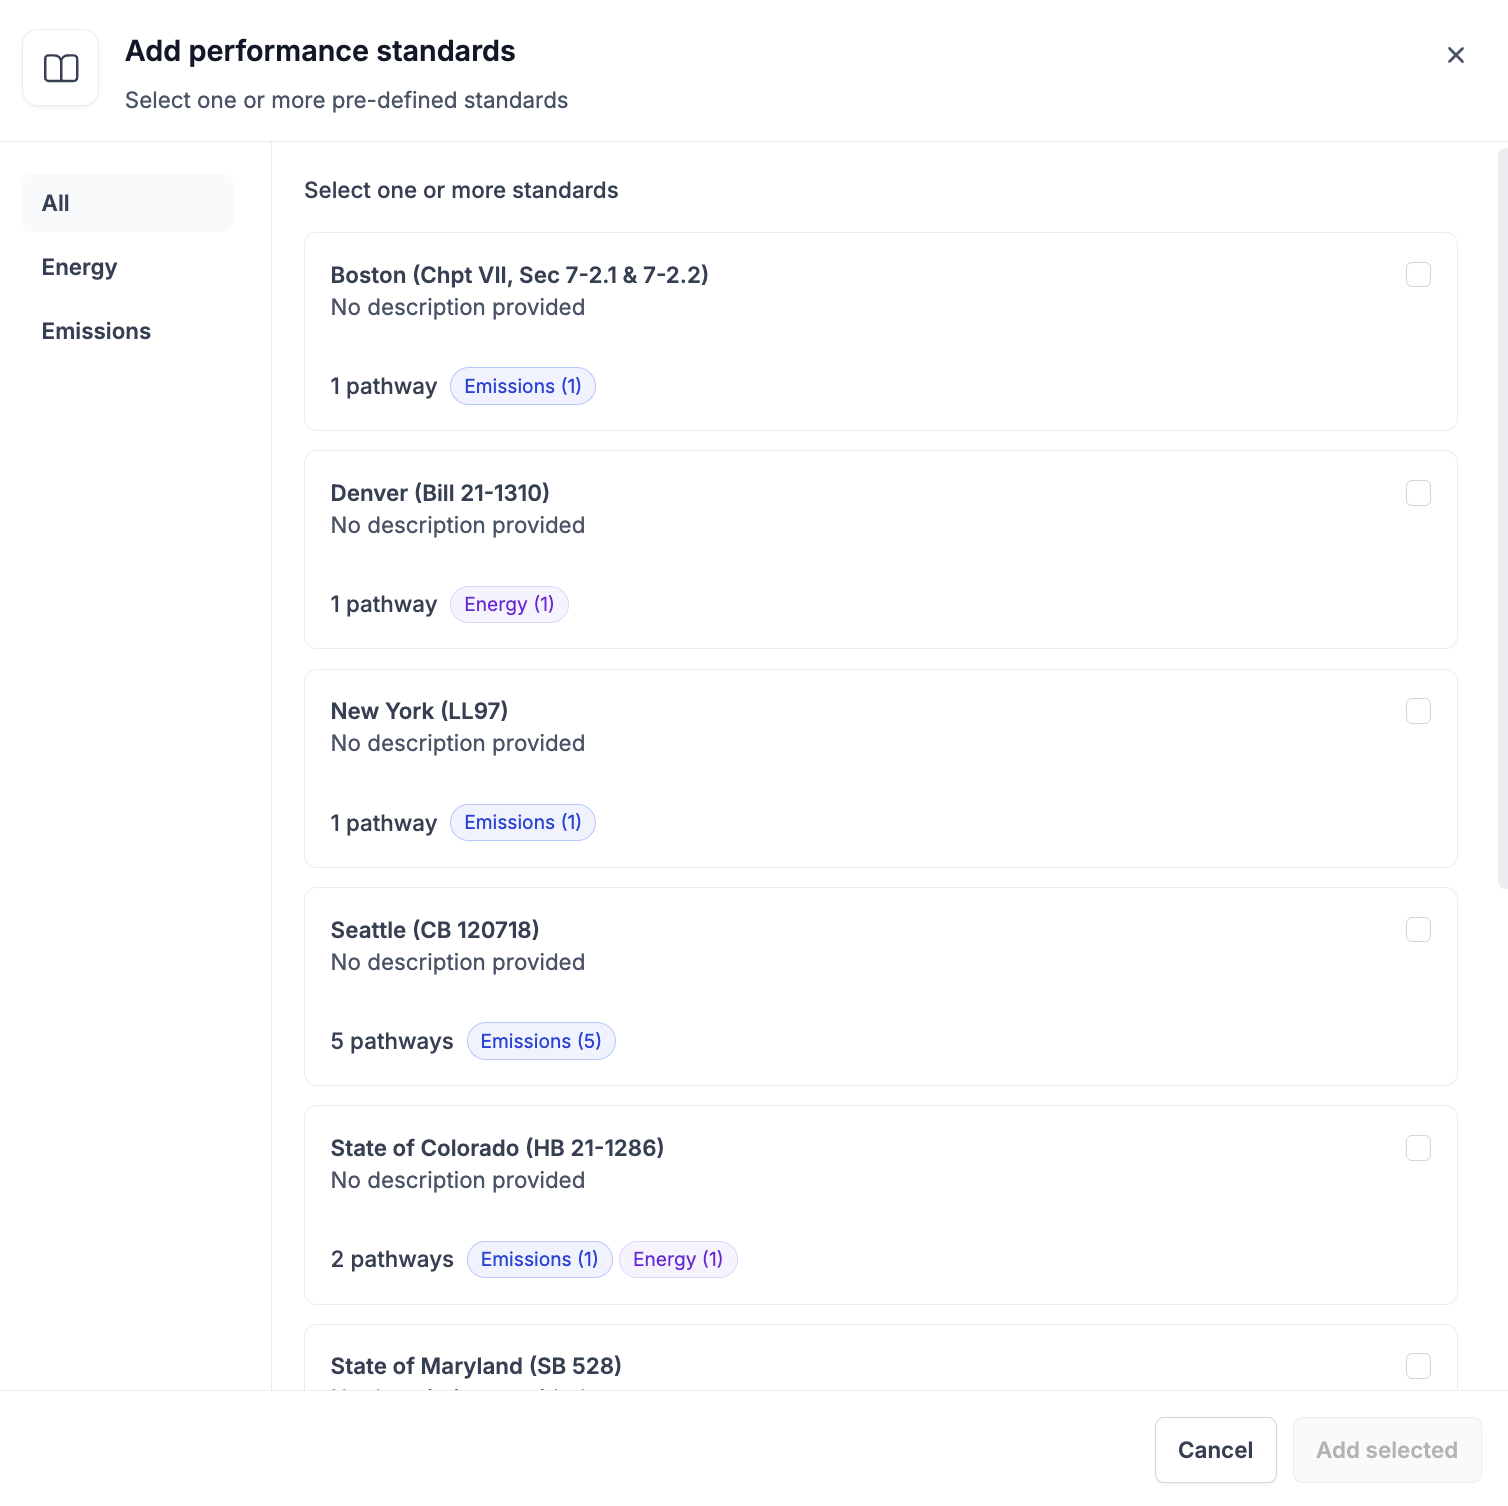
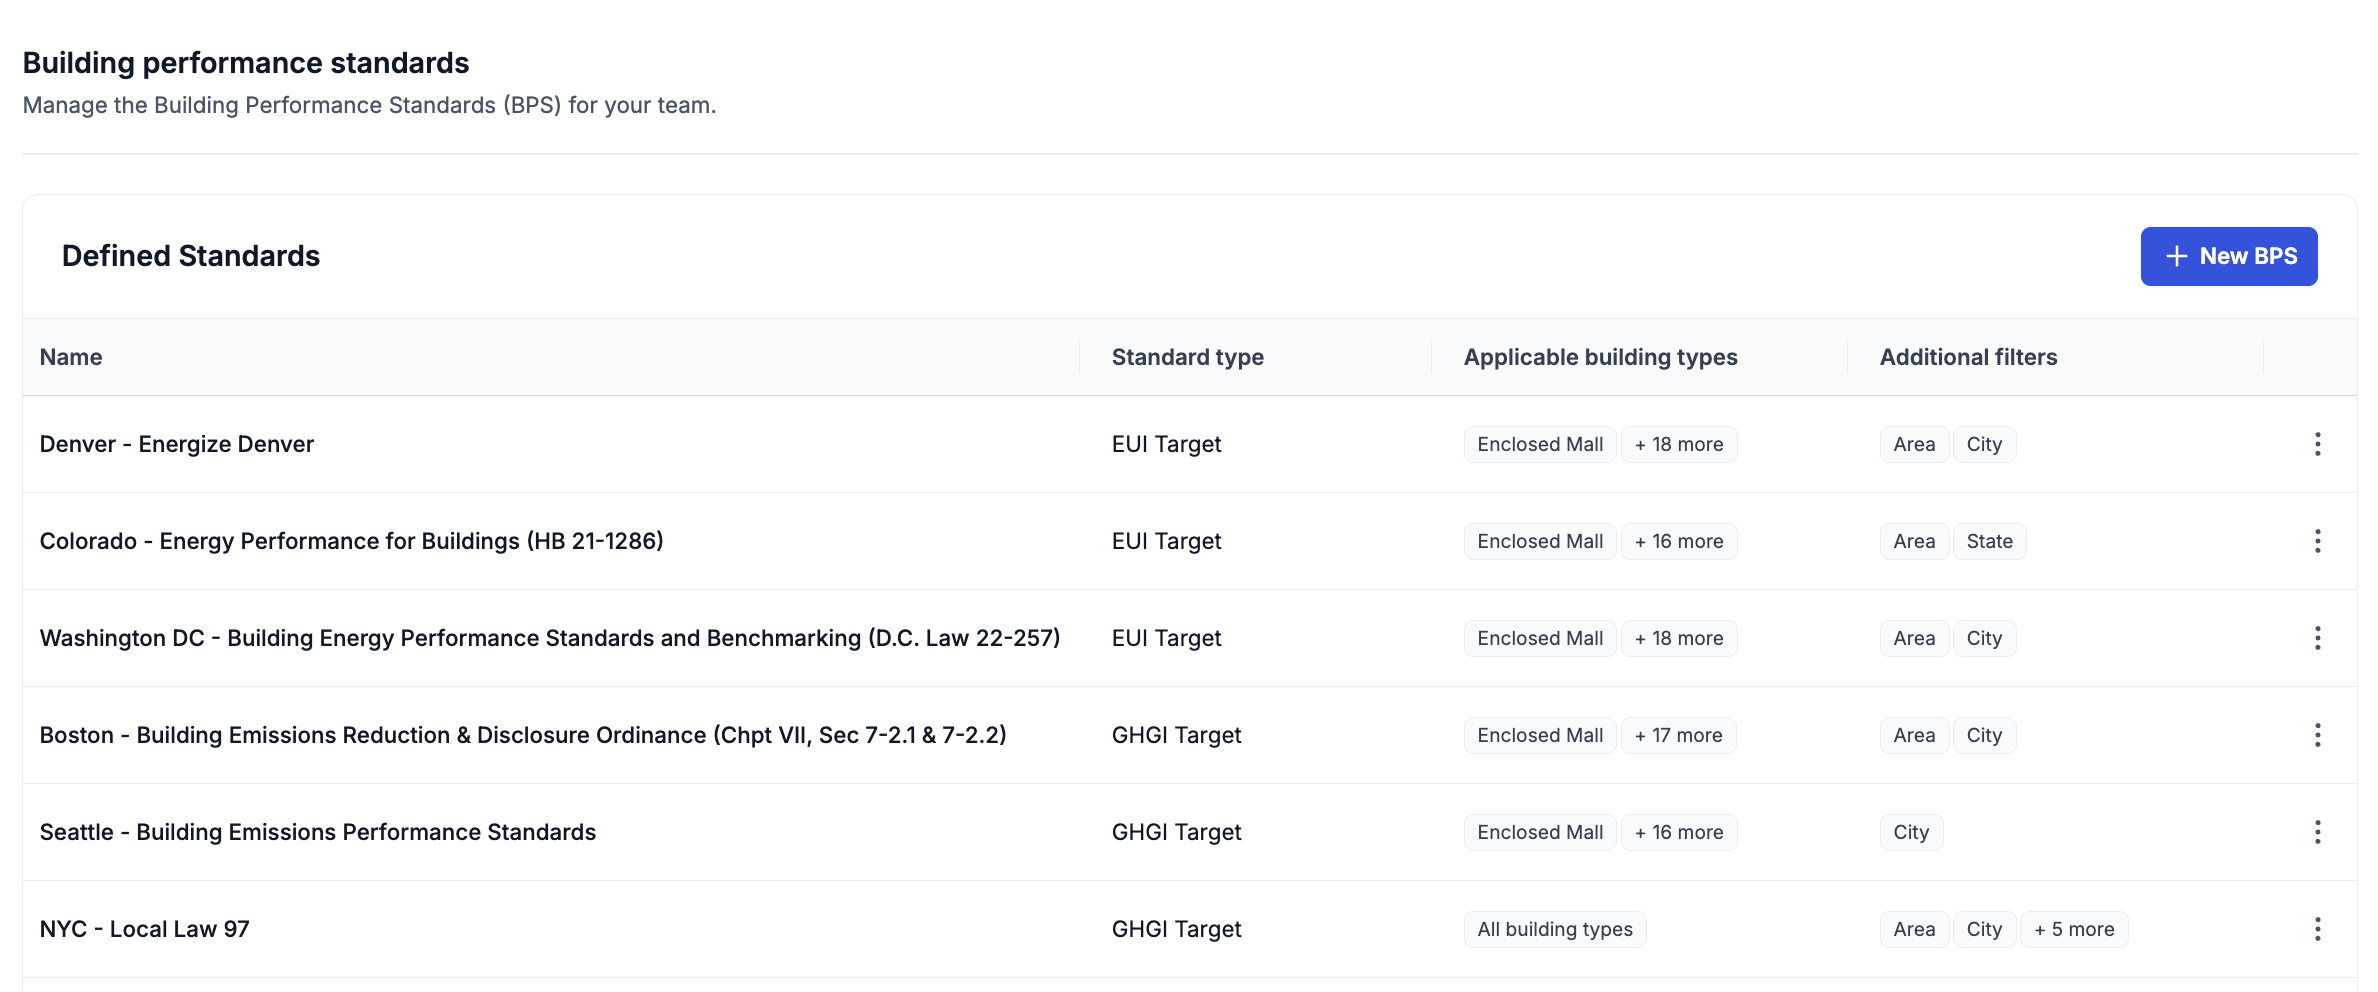
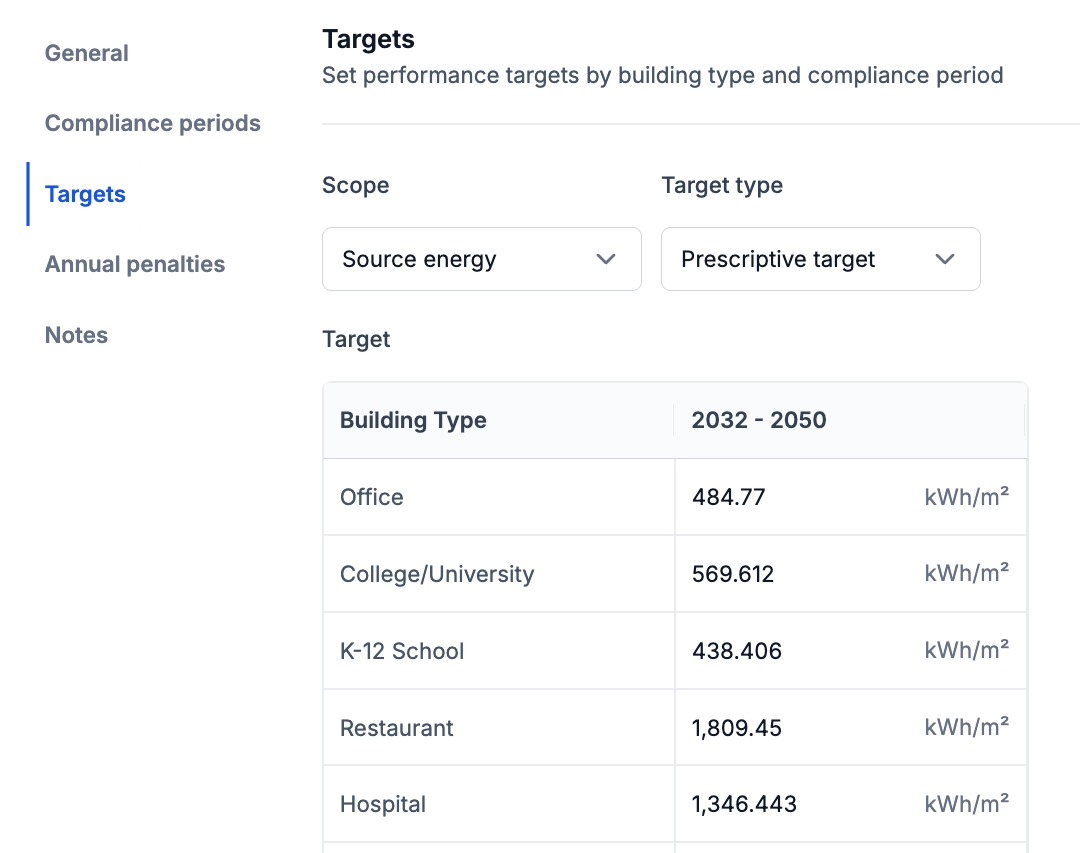
Expanded Building Performance Standards Support
We’ve enhanced Building Performance Standards (BPS) to support more complex compliance requirements.
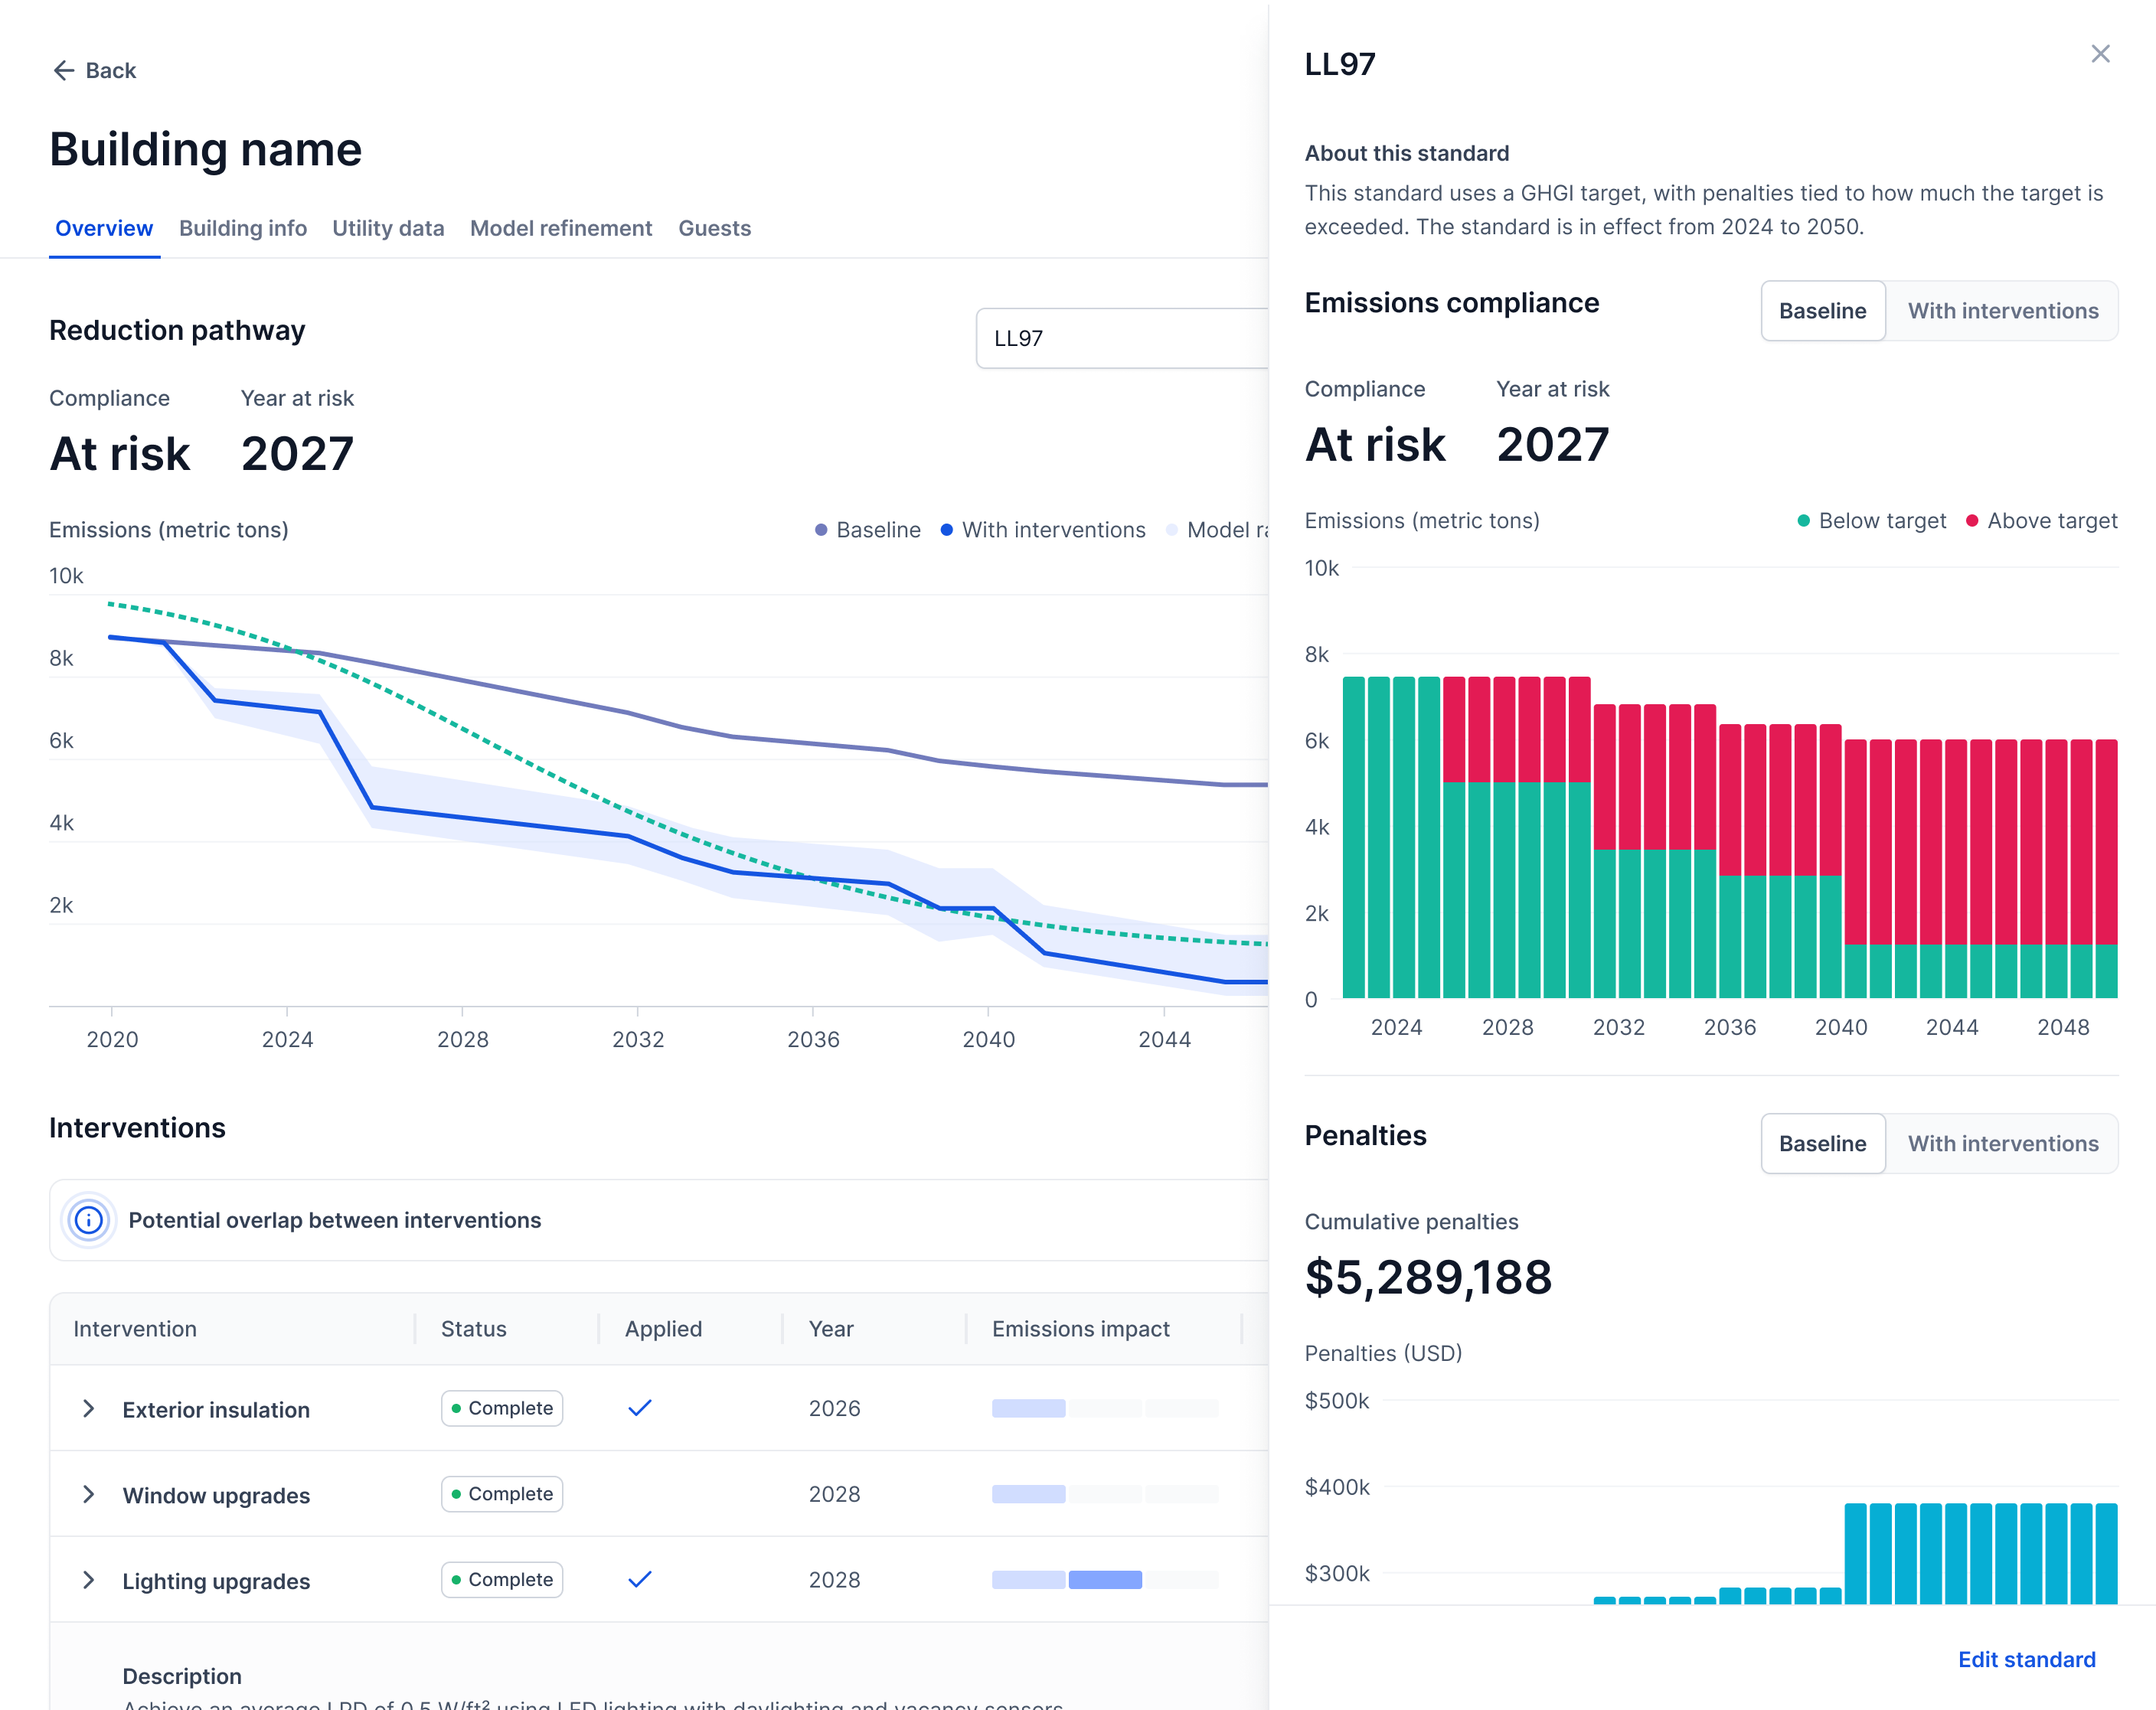
Source Energy Targets
This allows Carbon Signal to model regulations and voluntary standards that use source energy as the primary compliance metric.
Mixed-Use Building Compliance
Buildings can now include both a primary and secondary building type, along with the percent of floor area assigned to each use.
Carbon Signal automatically adjusts performance targets, compliance status, and penalty calculations based on the weighted contribution of each occupancy type.
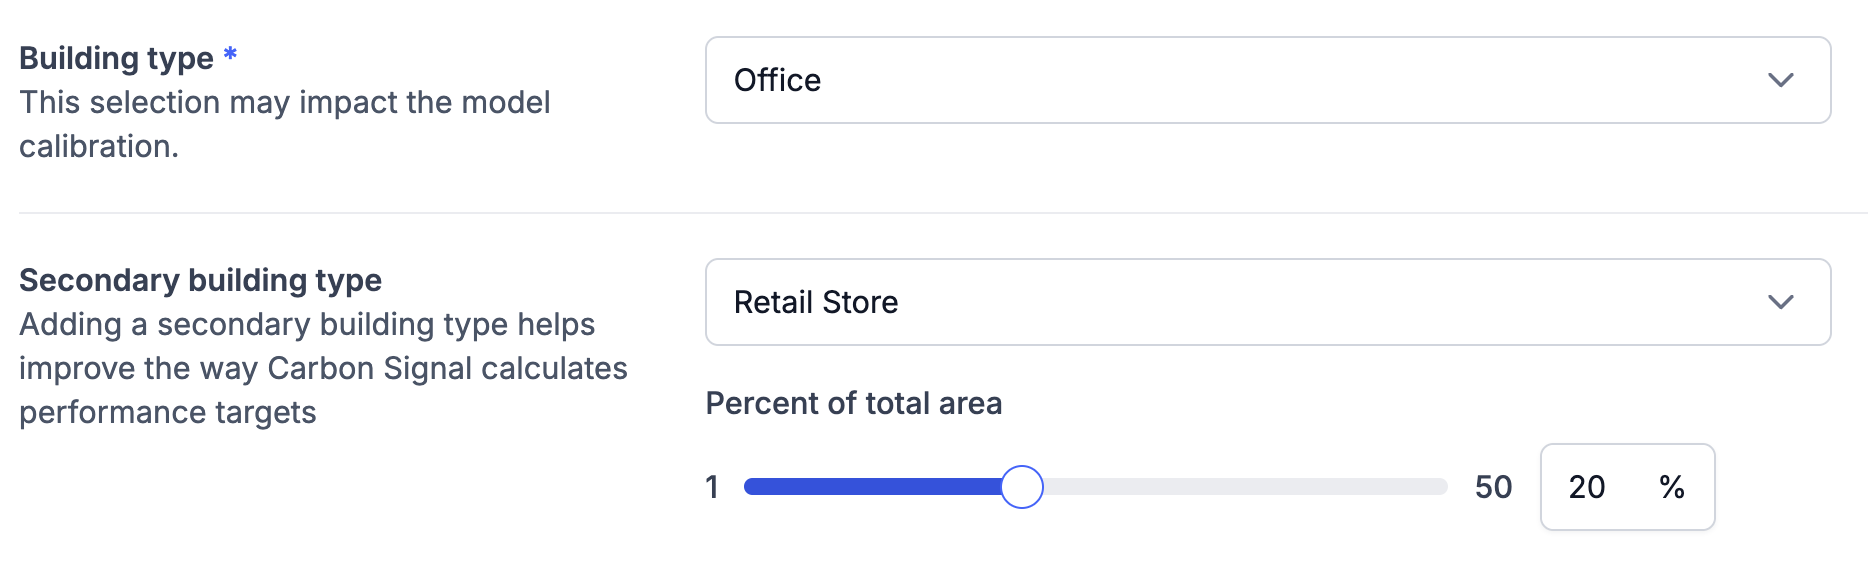
This improvement enables more accurate modeling of mixed-use properties such as office buildings with retail space, hotels with restaurants, and multifamily buildings with ground-floor commercial uses.